How To Make a Tally Chart

आप इस स्टोरीबोर्ड को निम्नलिखित लेखों और संसाधनों में पा सकते हैं:

आकर्षक शैक्षणिक दृश्य बनाएं: किसी प्रक्रिया का आरेख कैसे बनाएं
अन्ना वारफील्ड द्वारा पाठ योजनाएं
दृश्यों के साथ निर्देशों और प्रक्रियाओं को बहुत आसानी से समझा जा सकता है। जब हम किसी प्रक्रिया को स्टोरीबोर्ड करते हैं या अनुक्रमिक आरेख बनाते हैं, तो हम असतत चरणों, कारण और प्रभाव, और अनुक्रम पर ध्यान केंद्रित कर सकते हैं।

Storyboards साथ टैली चार्ट शिक्षण
अन्ना वारफील्ड द्वारा पाठ योजनाएं
शिक्षकों के रूप में, हमें महत्वपूर्ण डेटा-संचालित फ्यूचर्स के लिए थोड़ा दिमाग तैयार करने की आवश्यकता है। टैली चार्ट का उपयोग करना और समझना आसान है, इसलिए यह पहली बार शोधकर्ताओं के लिए एक उत्कृष्ट विकल्प है। Storyboard That के साथ और जानें!
'
स्टोरीबोर्ड विवरण
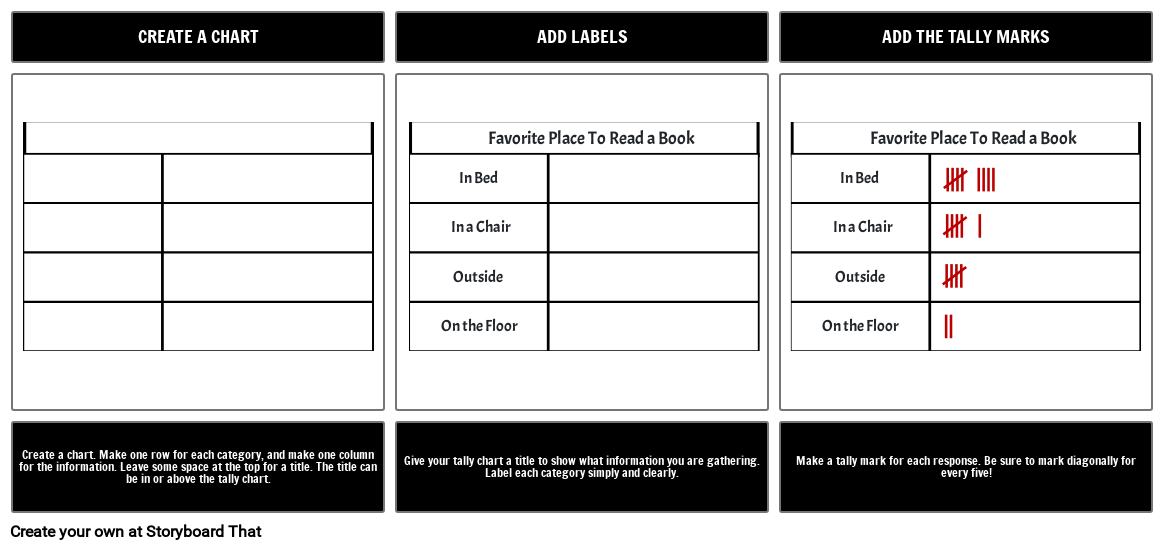
Making a tally chart is easy. Make a box, add some labels, and tally ho!
स्टोरीबोर्ड पाठ
- फिसलना: 1
- CREATE A CHART
- Favorite Place To Read a Book Favorite Place To Read a Book
- In Bed In Bed
- In a Chair In a Chair
- Outside Outside
- On the Floor On the Floor
- Create a chart. Make one row for each category, and make one column for the information. Leave some space at the top for a title. The title can be in or above the tally chart.
- फिसलना: 2
- ADD LABELS
- Give your tally chart a title to show what information you are gathering. Label each category simply and clearly.
- फिसलना: 3
- ADD THE TALLY MARKS
- Make a tally mark for each response. Be sure to mark diagonally for every five!
30 मिलियन से अधिक स्टोरीबोर्ड बनाए गए
कोई डाउनलोड नहीं, कोई क्रेडिट कार्ड नहीं, और कोशिश करने के लिए किसी लॉगिन की आवश्यकता नहीं है!
