How To Make a Tally Chart

Ten zestaw zdarzeń można znaleźć w następujących artykułach i zasobach:

Tworzenie Angażujących Materiałów Edukacyjnych: Jak Przedstawić Proces na Diagramie
Plany Lekcji Anny Warfield
Instrukcje i procesy są o wiele łatwiej zrozumiałe, gdy towarzyszą im wizualizacje. Kiedy tworzymy scenariusz procesu lub tworzymy sekwencyjny diagram, możemy skupić się na dyskretnych krokach, przyczynie i skutku oraz sekwencji.

Nauczanie wykresów z tablicami scenograficznymi
Plany Lekcji Anny Warfield
Jako nauczyciele musimy przygotować małe umysły na ważne przyszłości oparte na danych. Wykres sumaryczny jest łatwy w użyciu i zrozumiały, dlatego jest doskonałym wyborem dla początkujących badaczy. Dowiedz się więcej dzięki Storyboard That!
'
Storyboard Opis
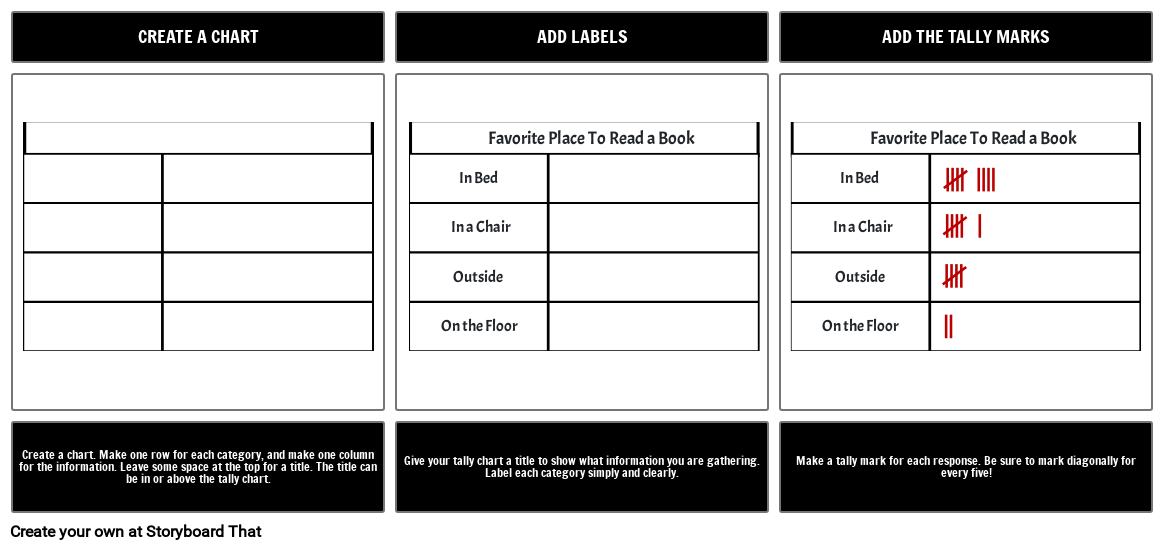
Making a tally chart is easy. Make a box, add some labels, and tally ho!
Tekst Storyboardowy
- Slajd: 1
- CREATE A CHART
- Favorite Place To Read a Book Favorite Place To Read a Book
- In Bed In Bed
- In a Chair In a Chair
- Outside Outside
- On the Floor On the Floor
- Create a chart. Make one row for each category, and make one column for the information. Leave some space at the top for a title. The title can be in or above the tally chart.
- Slajd: 2
- ADD LABELS
- Give your tally chart a title to show what information you are gathering. Label each category simply and clearly.
- Slajd: 3
- ADD THE TALLY MARKS
- Make a tally mark for each response. Be sure to mark diagonally for every five!
Utworzono ponad 30 milionów scenorysów
Bez Pobierania, bez Karty Kredytowej i bez Logowania, aby Spróbować!
