Logger Pro: Velocity vs Time Graph Analysis

Texto del Guión Gráfico
- Logger Pro: Velocity vs Time Graph Analysis
- Introduction
- Blue Pad: used to detect motion
- Experiment
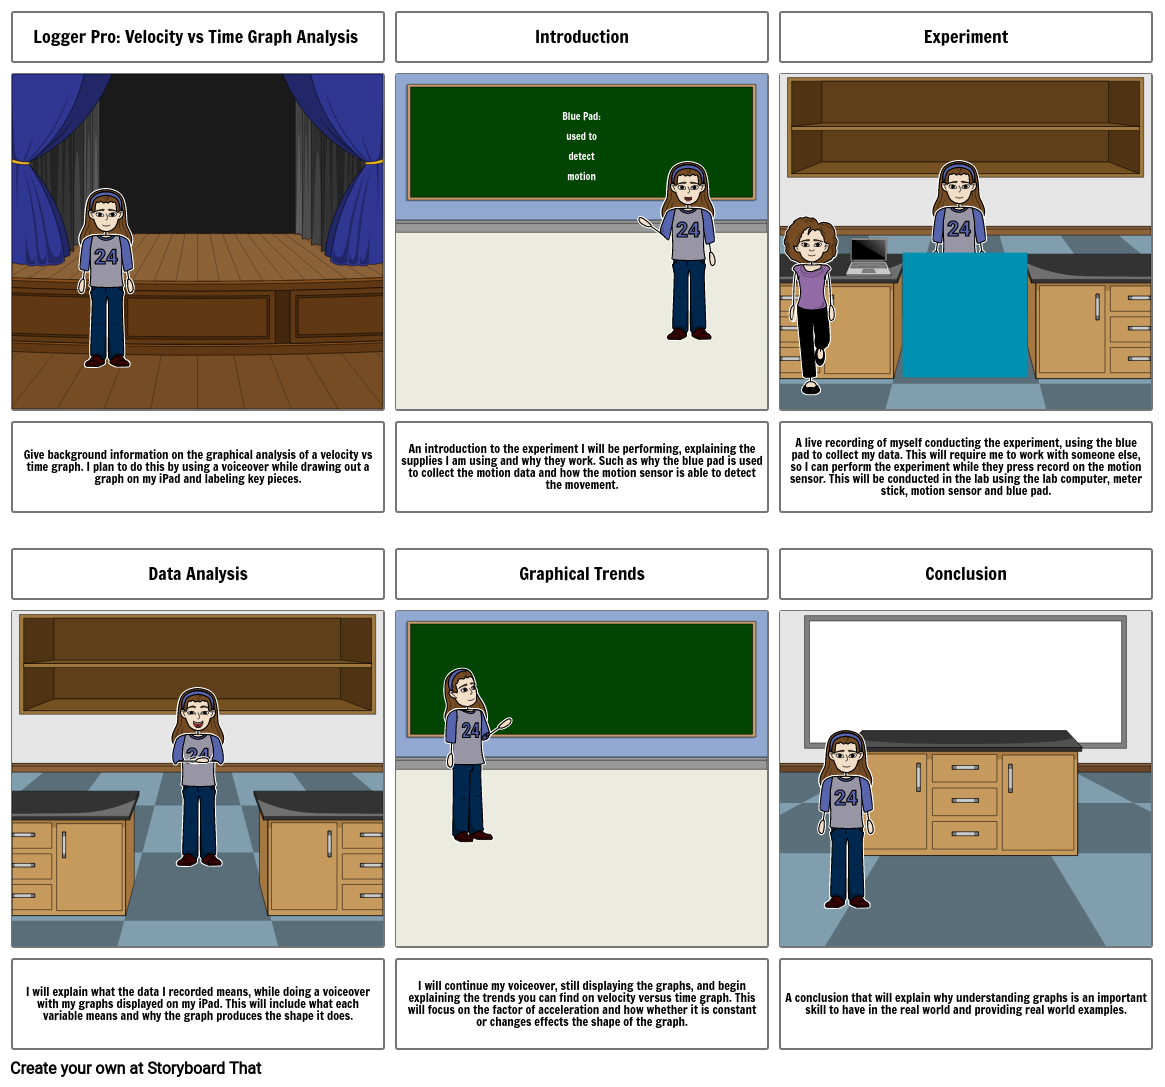
- Give background information on the graphical analysis of a velocity vs time graph. I plan to do this by using a voiceover while drawing out a graph on my iPad and labeling key pieces.
- Data Analysis
- An introduction to the experiment I will be performing, explaining the supplies I am using and why they work. Such as why the blue pad is used to collect the motion data and how the motion sensor is able to detect the movement.
- Graphical Trends
- A live recording of myself conducting the experiment, using the blue pad to collect my data. This will require me to work with someone else, so I can perform the experiment while they press record on the motion sensor. This will be conducted in the lab using the lab computer, meter stick, motion sensor and blue pad.
- Conclusion
- I will explain what the data I recorded means, while doing a voiceover with my graphs displayed on my iPad. This will include what each variable means and why the graph produces the shape it does.
- I will continue my voiceover, still displaying the graphs, and begin explaining the trends you can find on velocity versus time graph. This will focus on the factor of acceleration and how whether it is constant or changes effects the shape of the graph.
- A conclusion that will explain why understanding graphs is an important skill to have in the real world and providing real world examples.
Más de 30 millones de guiones gráficos creados

