Math work

Montāžas Teksta
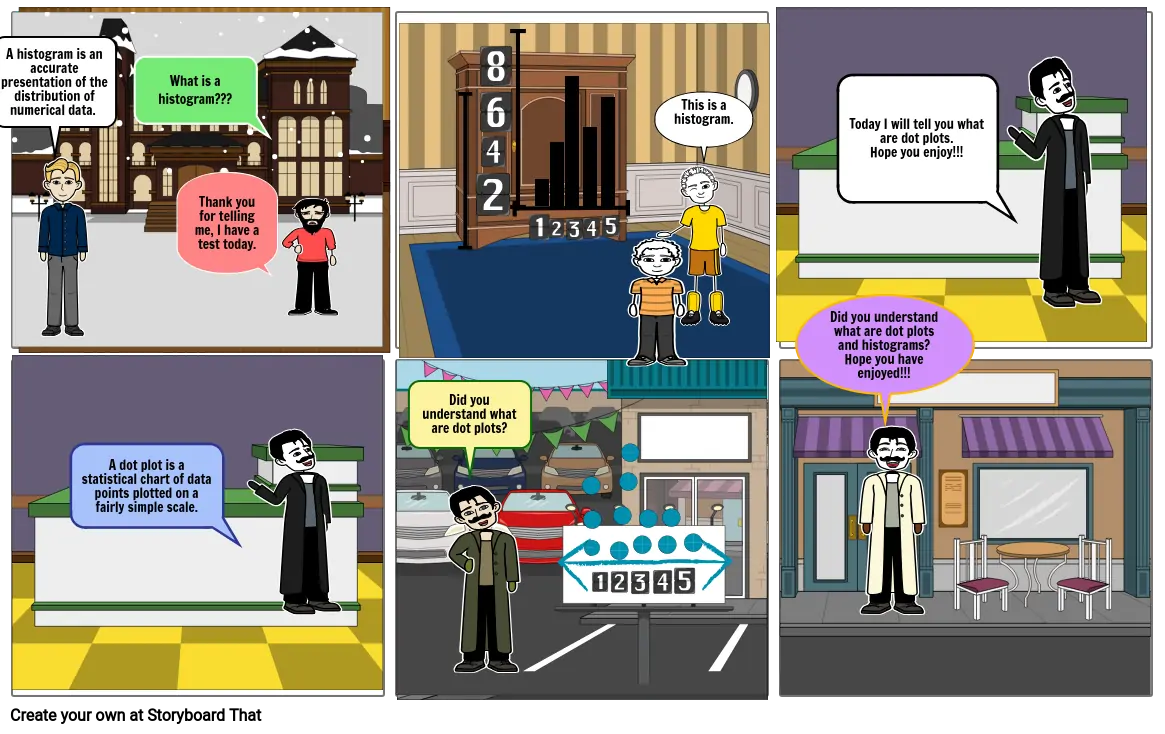
- A histogram is an accurate presentation of the distribution of numerical data.
- What is a histogram???
- Thank you for telling me, I have a test today.
- This is a histogram.
- Did you understand what are dot plots and histograms?Hope you have enjoyed!!!
- Today I will tell you what are dot plots.Hope you enjoy!!!
- A dot plot is a statistical chart of data points plotted on a fairly simple scale.
- Did you understand what are dot plots?
Izveidoti vairāk nekā 30 miljoni stāstu shēmu

