How To Make a Tally Chart

Leiate selle storyboard järgmistes esemed ja vahendid:

Looge Kaasahaaravaid Hariduslikke Visuaale: Kuidas Protsessi Skeemida
Anna Warfieldi Tunniplaanid
Juhised ja protsessid on visuaaliga palju lihtsamini mõistetavad. Kui loome protsessi süžeeskeemi või loome järjestikuse diagrammi, saame keskenduda diskreetsetele sammudele, põhjustele ja tagajärgedele ning järjestusele.

Õppetöö Tally graafikute Süžeeskeemid
Anna Warfieldi Tunniplaanid
Pedagoogidena peame valmistama väikesed meeled ette olulisteks andmepõhiseks tulevikuks. Tabelit on lihtne kasutada ja arusaadav, seega on see suurepärane valik esmakordsetele uurijatele. Lisateavet Storyboard That!
'
Süžeeskeem Kirjeldus
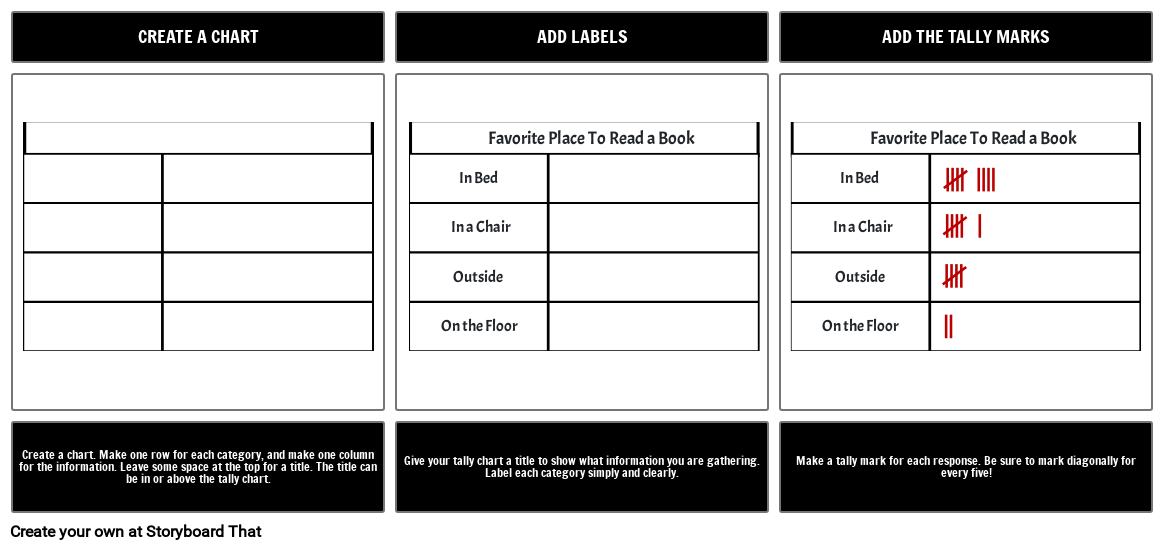
Making a tally chart is easy. Make a box, add some labels, and tally ho!
Süžeeskeem Tekst
- Libisema: 1
- CREATE A CHART
- Favorite Place To Read a Book Favorite Place To Read a Book
- In Bed In Bed
- In a Chair In a Chair
- Outside Outside
- On the Floor On the Floor
- Create a chart. Make one row for each category, and make one column for the information. Leave some space at the top for a title. The title can be in or above the tally chart.
- Libisema: 2
- ADD LABELS
- Give your tally chart a title to show what information you are gathering. Label each category simply and clearly.
- Libisema: 3
- ADD THE TALLY MARKS
- Make a tally mark for each response. Be sure to mark diagonally for every five!
Loodud üle 30 miljoni süžeeskeemi
Proovimiseks Pole Vaja Allalaadimist, Krediitkaarti ega Sisselogimist!
