How To Make a Tally Chart

Ova ploča scenarija možete pronaći u sljedećim člancima i resursima:

Izradite Zanimljive Edukativne Vizualne Prikaze: Kako Dijagramirati Proces
Planovi Lekcije Anna Warfield
Upute i procesi mnogo su lakše razumljivi ako ih prate vizualni elementi. Kada pravimo scenarij procesa ili stvaramo sekvencijalni dijagram, možemo se usredotočiti na diskretne korake, uzrok i posljedicu i slijed.

Podučavanje grafičkih kartica sa Storyboards
Planovi Lekcije Anna Warfield
Kao edukatori, moramo pripremiti male umove za važne budućnosti vođene podacima. Tablica je jednostavna za korištenje i razumijevanje, tako da je izvrstan izbor za istraživače koji prvi put ulaze u istraživanje. Saznajte više uz Storyboard That!
'
Opis Storyboarda
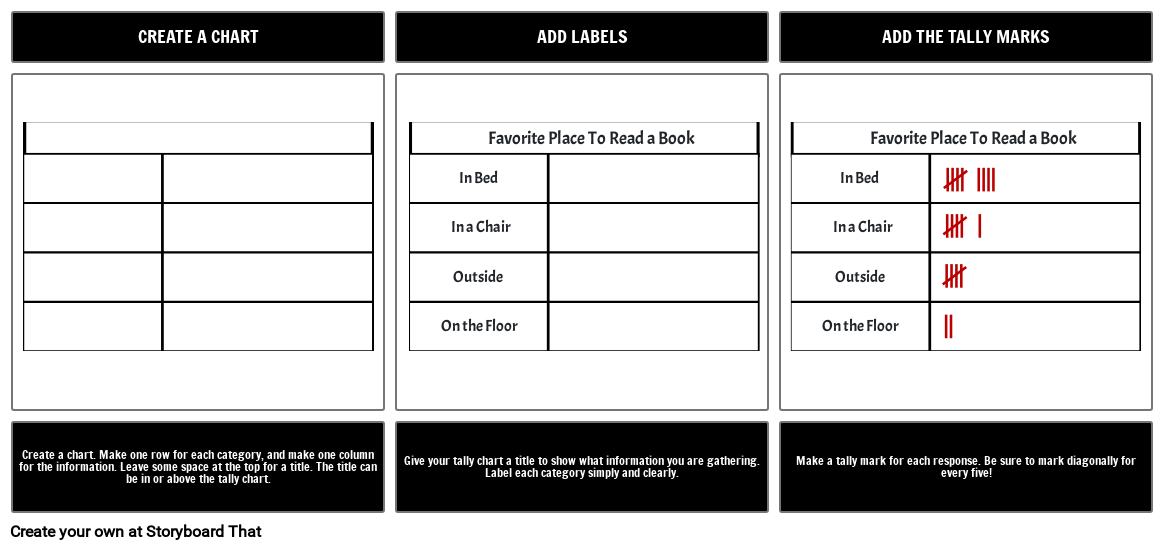
Making a tally chart is easy. Make a box, add some labels, and tally ho!
Storyboard Tekst
- Slajd: 1
- CREATE A CHART
- Favorite Place To Read a Book Favorite Place To Read a Book
- In Bed In Bed
- In a Chair In a Chair
- Outside Outside
- On the Floor On the Floor
- Create a chart. Make one row for each category, and make one column for the information. Leave some space at the top for a title. The title can be in or above the tally chart.
- Slajd: 2
- ADD LABELS
- Give your tally chart a title to show what information you are gathering. Label each category simply and clearly.
- Slajd: 3
- ADD THE TALLY MARKS
- Make a tally mark for each response. Be sure to mark diagonally for every five!
Izrađeno više od 30 milijuna scenarija
Bez Preuzimanja, bez Kreditne Kartice i bez Prijave!
