How To Make a Tally Chart

È possibile trovare questo storyboard nei seguenti articoli e risorse:

Creare Immagini Didattiche Coinvolgenti: Come Diagrammare un Processo
Piani di Lezione di Anna Warfield
Le istruzioni e le procedure sono molto più facilmente comprensibili se accompagnate da elementi visivi. Quando realizziamo lo storyboard di un processo o creiamo un diagramma sequenziale, possiamo concentrarci su passaggi discreti, causa ed effetto e sequenza.

Insegnare Tally grafici con storyboard
Piani di Lezione di Anna Warfield
Come educatori, dobbiamo preparare le piccole menti per importanti futuri basati sui dati. Il grafico di conteggio è facile da usare e da capire, quindi è una scelta eccellente per i ricercatori alle prime armi. Scopri di più con Storyboard That!
'
Storyboard Descrizione
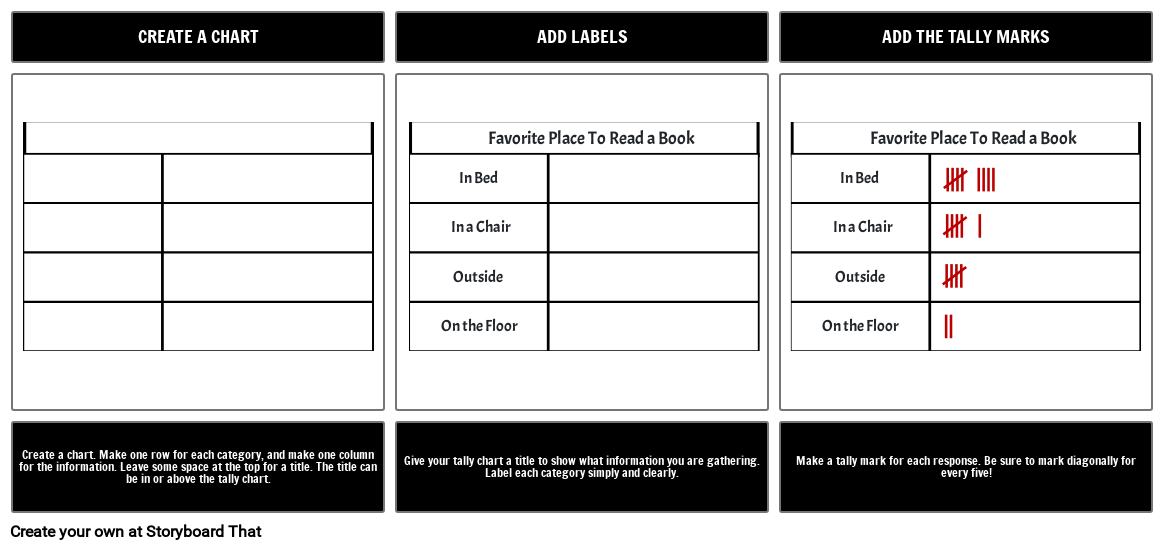
Making a tally chart is easy. Make a box, add some labels, and tally ho!
Testo Storyboard
- Diapositiva: 1
- CREATE A CHART
- Favorite Place To Read a Book Favorite Place To Read a Book
- In Bed In Bed
- In a Chair In a Chair
- Outside Outside
- On the Floor On the Floor
- Create a chart. Make one row for each category, and make one column for the information. Leave some space at the top for a title. The title can be in or above the tally chart.
- Diapositiva: 2
- ADD LABELS
- Give your tally chart a title to show what information you are gathering. Label each category simply and clearly.
- Diapositiva: 3
- ADD THE TALLY MARKS
- Make a tally mark for each response. Be sure to mark diagonally for every five!
Oltre 30 milioni di storyboard creati
Nessun Download, Nessuna Carta di Credito e Nessun Accesso Necessario per Provare!
