Free Infographic Maker
Create, publish, and share an impressive infographic in just minutes
Super Easy to Use • Fast to Create and Share • No Drawing Required
Browse Our Premade Infographic Templates
Why Do People Like to Use Storyboard That to Create Professional Infographic Templates?
In the world of business, where attention is a precious commodity, harnessing the potential of infographics is a strategic move. By using an infographic tool to create your own content, you tap into the power of visual storytelling. From professionally designed templates to the freedom of crafting your own custom infographic, these visuals can elevate your marketing and communication efforts. Whether you're using your design skills to share complex data, explain your products, or simply to enhance engagement, infographics are a dynamic and versatile asset in your business toolkit.
How to Create an Infographic
1
Click on the “Create a Storyboard Button”
This will take you to our state of the art storyboard creator.
2
Give Your Storyboard a Name
Be sure to call it something related to the topic so that you can easily find it in the future.
3
Choose the "Worksheet" Layout
Click on the "layout" button at the top of the right hand menu. Choose the "worksheet" or "poster" layout. Choose if you would like it to be horizontal or vertical, then click the orange "okay" button. Note: you can choose any layout that you would like!
4
Add Your Infographics
At the top of the page, you will see a white bar with lots of options. Choose the "infographics" option. Once you do that, you will be able to choose icons, charts, banners, and more! The drag and drop feature makes customizing a breeze! Don't want to make a wireframe from scratch? Check out our infographic templates for education and our infographic templates for business !
5
Click "Save and Exit"
Once you have added all of your images and text, click the "save and exit" button in the lower right hand corner to exit. It’s time to share your storyboard with your colleagues and customers!
Frequently Asked Questions about Infographics
What are the benefits of using infographics?
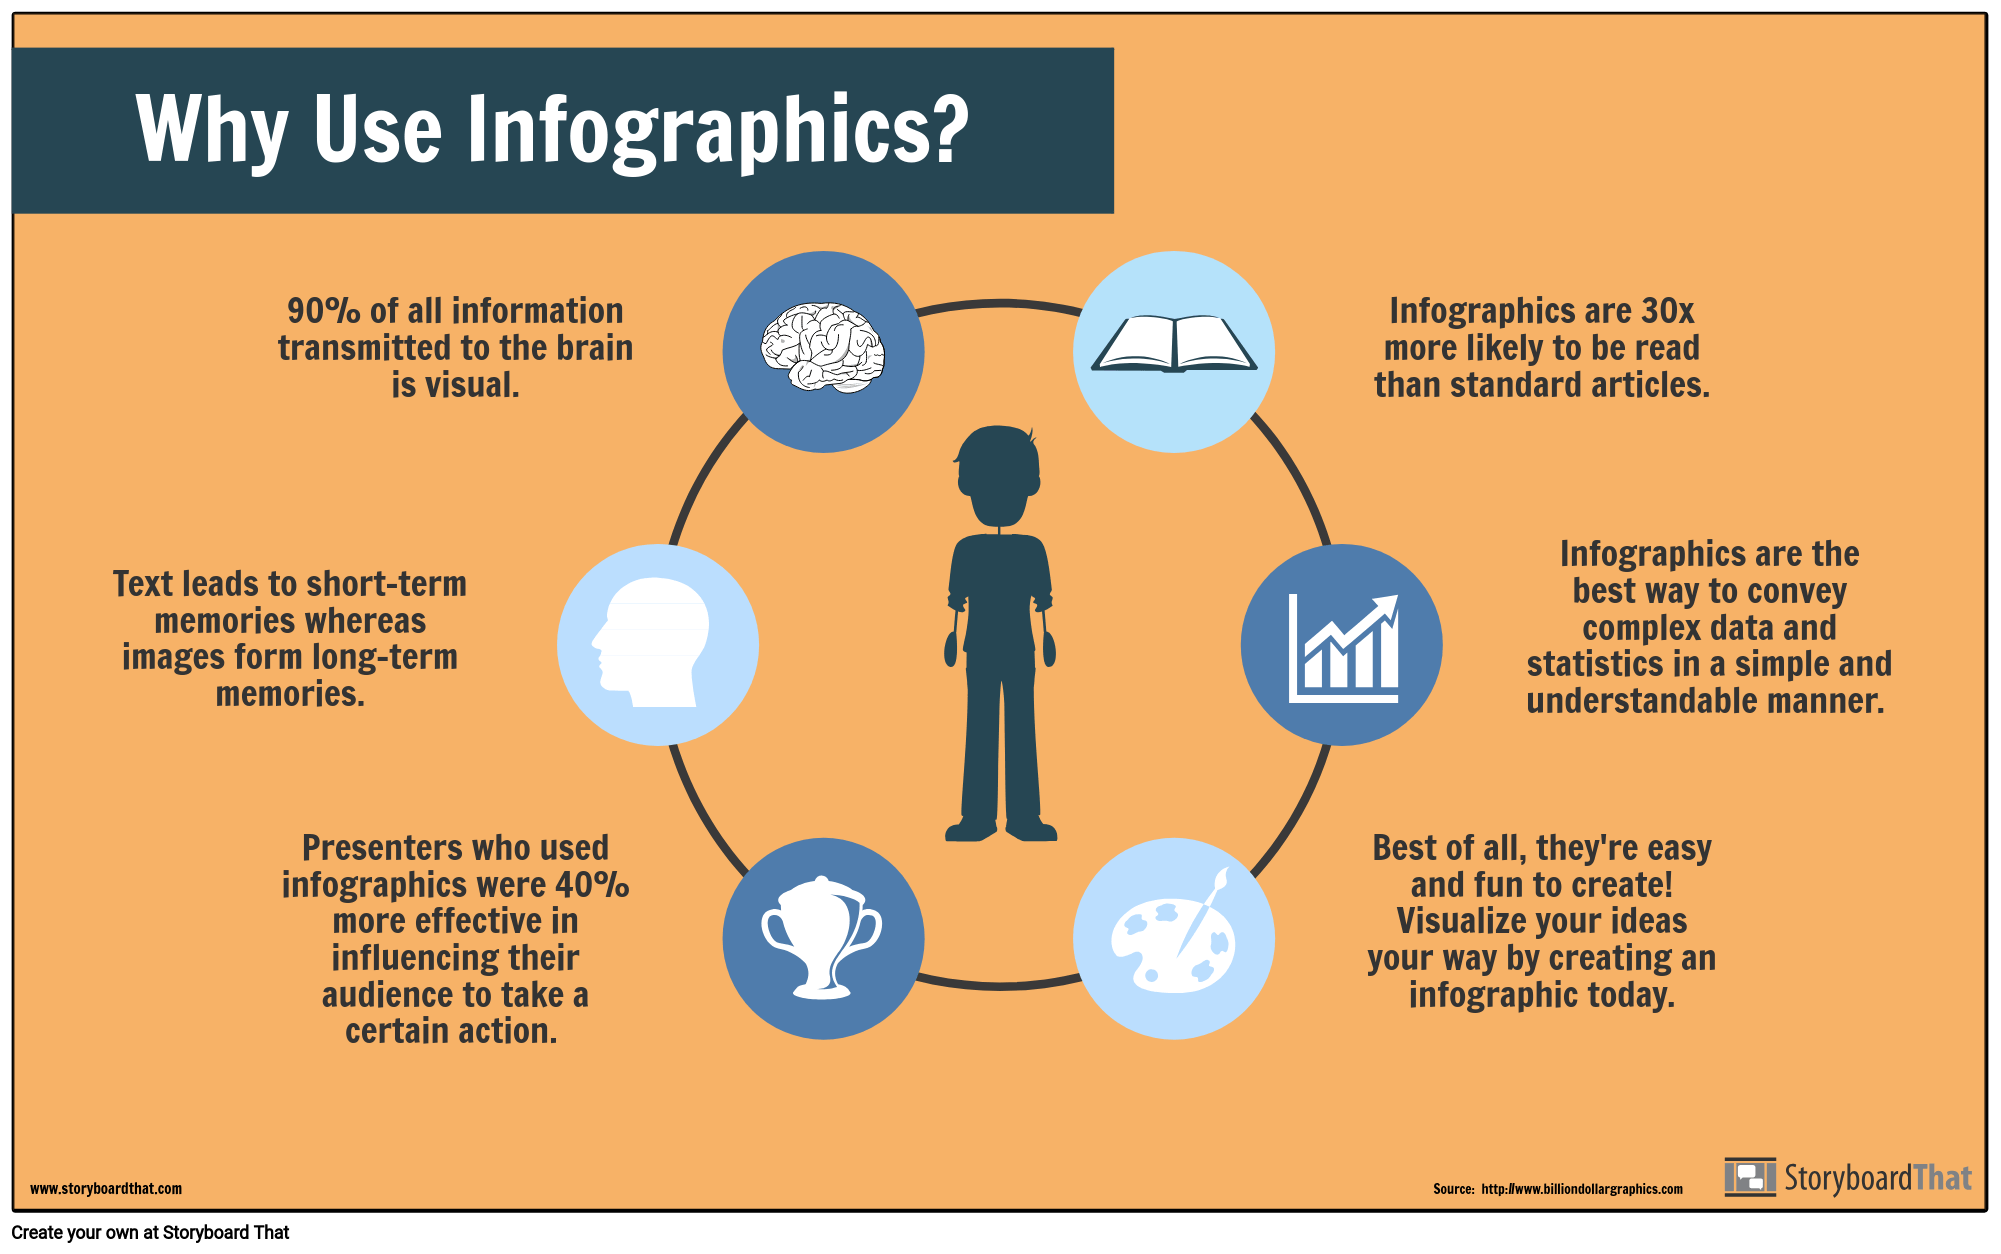
Infographics are a powerful tool for communication because they help people to understand data visualization and complex information more quickly and easily than text alone. They are also more visually appealing and engaging than traditional reports or presentations.
What types of data can be presented in infographics?
Infographics can be used to present any type of data or information, including statistics, survey results, timelines, maps, diagrams, and more.
What are the key elements of a good infographic?
It should have a clear and concise message, a visually appealing design, and accurate and well-organized data. It should also be easy to understand and shareable.
Can infographics be used for marketing purposes?
Yes, they can be an effective tool for marketing because they can help to explain complex products or services in a simple and engaging way. They can also be easily shared on social media and other online platforms, making them a great way to reach a wide audience.
How do I know if my infographic is successful?
The success can be measured in a number of ways, including its reach, engagement, and conversions. You can track these metrics using tools like Google Analytics and social media analytics.


