Unknown Story

Storyboard Text
- x y0 51 72 93 11
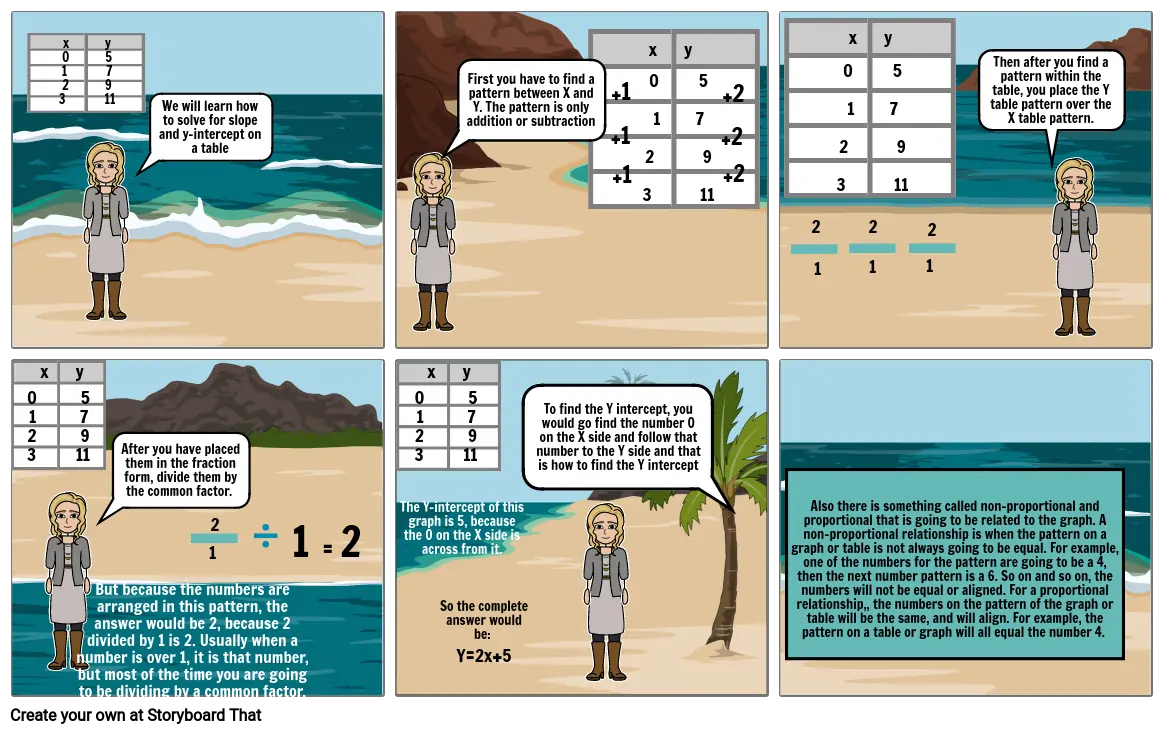
- We will learn how to solve for slope and y-intercept on a table
- First you have to find a pattern between X and Y. The pattern is only addition or subtraction
- +1
- +1
- +1
- 0 51 72 93 11
- x y
- +2
- +2
- +2
- 2
- 1
- 0 51 72 93 11
- x y
- 2
- 1
- 1
- 2
- Then after you find a pattern within the table, you place the Y table pattern over the X table pattern.
- 0 51 72 93 11
- x y
- But because the numbers are arranged in this pattern, the answer would be 2, because 2 divided by 1 is 2. Usually when a number is over 1, it is that number, but most of the time you are going to be dividing by a common factor.
- After you have placed them in the fraction form, divide them by the common factor.
- 1
- 2
- 1 = 2
- The Y-intercept of this graph is 5, because the 0 on the X side is across from it.
- 0 51 72 93 11
- x y
- So the complete answer would be: Y=2x+5
- To find the Y intercept, you would go find the number 0 on the X side and follow that number to the Y side and that is how to find the Y intercept
- Also there is something called non-proportional and proportional that is going to be related to the graph. A non-proportional relationship is when the pattern on a graph or table is not always going to be equal. For example, one of the numbers for the pattern are going to be a 4, then the next number pattern is a 6. So on and so on, the numbers will not be equal or aligned. For a proportional relationship,, the numbers on the pattern of the graph or table will be the same, and will align. For example, the pattern on a table or graph will all equal the number 4.
Over 30 Million Storyboards Created

