Experimental Design for Students
Science is a mixture of historically accumulated knowledge and skills. These practical skills range from problem solving to data analysis; they are wide reaching and can frequently be applied outside the classroom. The teaching of these skills is a very important part of science education, but is often overlooked when focused on teaching the content. As science educators, we have all seen the benefits practical work has for student engagement and understanding. However, with the time constraints placed on the curriculum, the time needed for students to develop these investigative skills can get squeezed out. Too often we give students a ‘recipe’ to follow, which doesn’t allow students to take ownership of their practical work. From a very young age, students start to think about the world around them. They ask questions then use observations and evidence to answer them. Students tend to have intelligent, interesting, and testable questions that they love to ask. As educators, we should be working towards encouraging these questions and in turn, nurturing this natural curiosity in the world around them.
Teaching the design of experiments and letting students develop their own questions and hypotheses takes time. These materials have been created to scaffold and structure the process to allow teachers to focus on improving the key ideas in experimental design. Allowing students to ask their own questions, write their own hypotheses, and plan and carry out their own investigations is a valuable experience for them. This will lead to students having more ownership of their work. When students carry out the experimental method for their own questions, they reflect on how scientists have historically come to understand how the universe works.
Take a look at the printer-friendly pages and worksheet templates below!
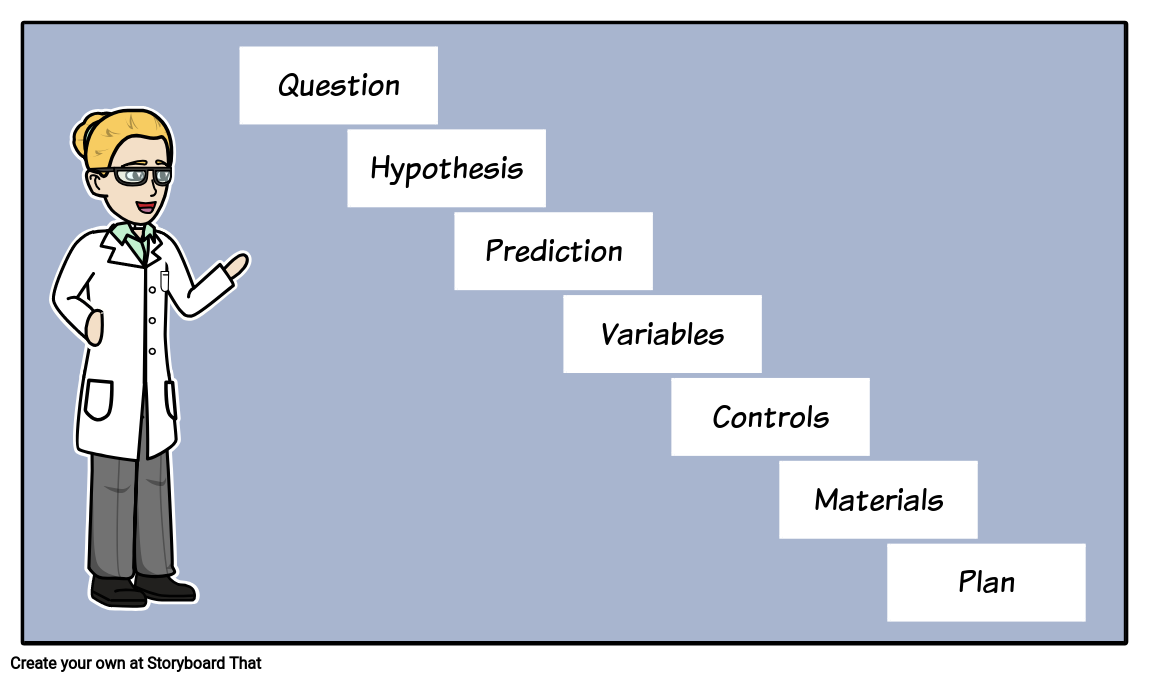
Experimental Design Steps
1. Question
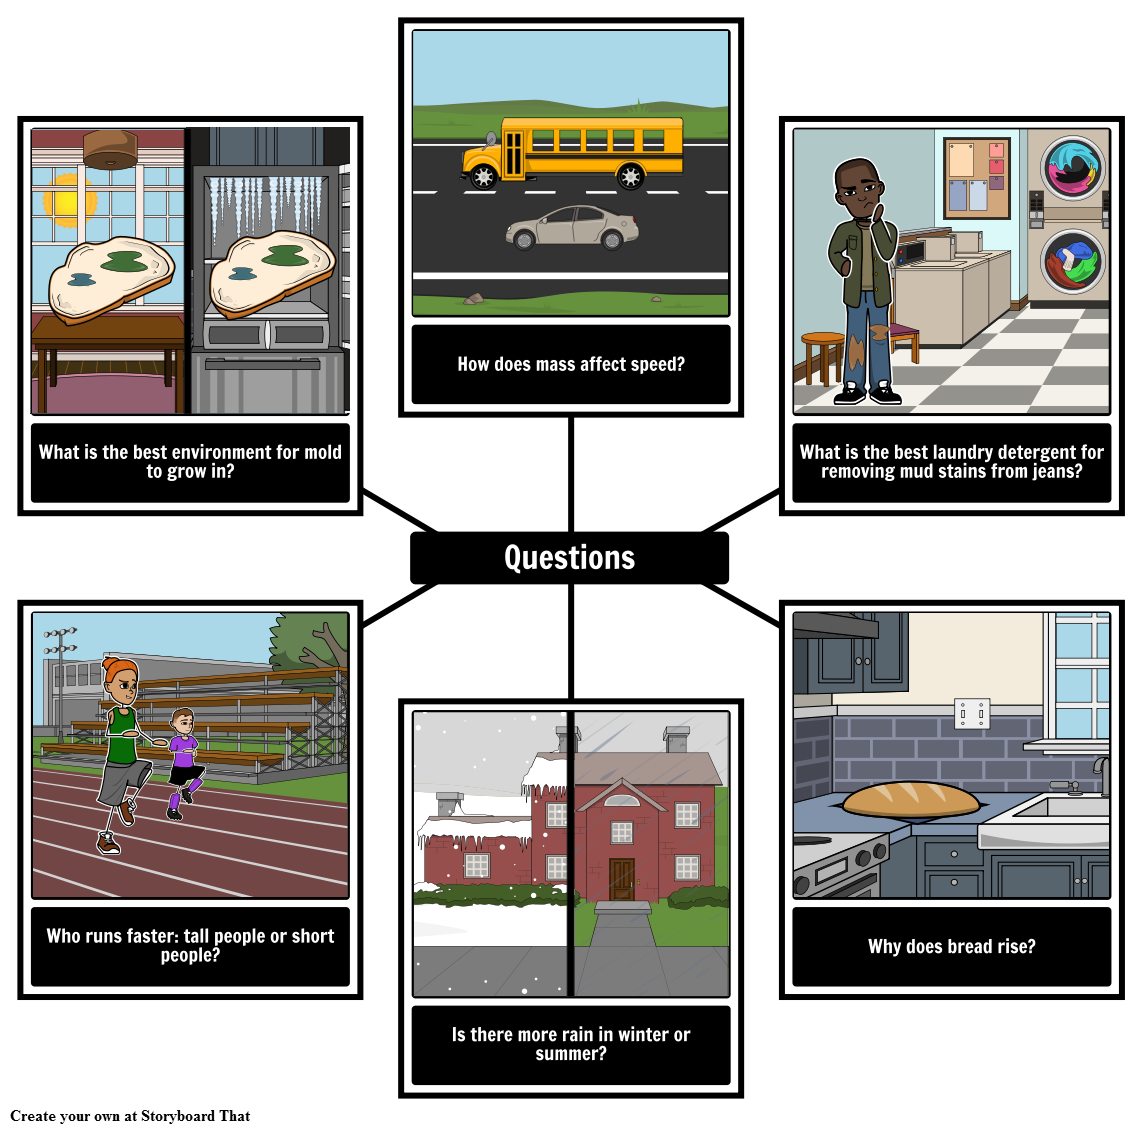
This is a key part of the scientific method and the experimental design process. Students enjoy coming up with questions. Formulating questions is a deep and meaningful activity that can give students ownership over their work. A great way of getting students to think of visualize their questions is using a mind map storyboard.
Ask students to think of any questions they want to answer about the universe or get them to think about questions they have about a particular topic. All questions are good questions, but some are easier to test than others.
2. Hypothesis
A hypothesis is known as an educated guess. A hypothesis should be a statement that can be tested scientifically. At the end of the experiment, look back to see whether the conclusion supports the hypothesis or not. Forming good hypotheses can be challenging for students to grasp. It is important to remember that the hypothesis is not a question, it is a testable statement.
One way of forming a hypothesis is to form it as an “if... then...” statement. This certainly isn't the only or best way to form a hypothesis, but can be a very easy formula for students to use when first starting out. An “if... then...” statement requires students to identify the variables first, and that may change the order in which they complete the stages of the visual organizer.
After identifying the variables, the hypothesis then takes the form if [change in independent variable], then [change in dependent variable]. For example, if an experiment were looking for the effect of caffeine on reaction time, the independent variable would be amount of caffeine and the dependent variable would be reaction time. The “if, then” hypothesis could be: If you increase the amount of caffeine taken, then the reaction time will decrease.
3. Explanation of Hypothesis
What led you to this hypothesis? What is the scientific background behind your hypothesis? Depending on age and ability, students use their prior knowledge to explain why they have chosen their hypotheses, or alternatively, research using books or the internet. This could also be a good time to discuss with students what a reliable source is.
4. Prediction
The prediction is slightly different to the hypothesis. A hypothesis is a testable statement, whereas the prediction is more specific to the experiment. In the discovery of the structure of DNA, the hypothesis proposed that DNA has a helical structure. The prediction was that the X-ray diffraction pattern of DNA would be an X shape.
5. Identification of Variables
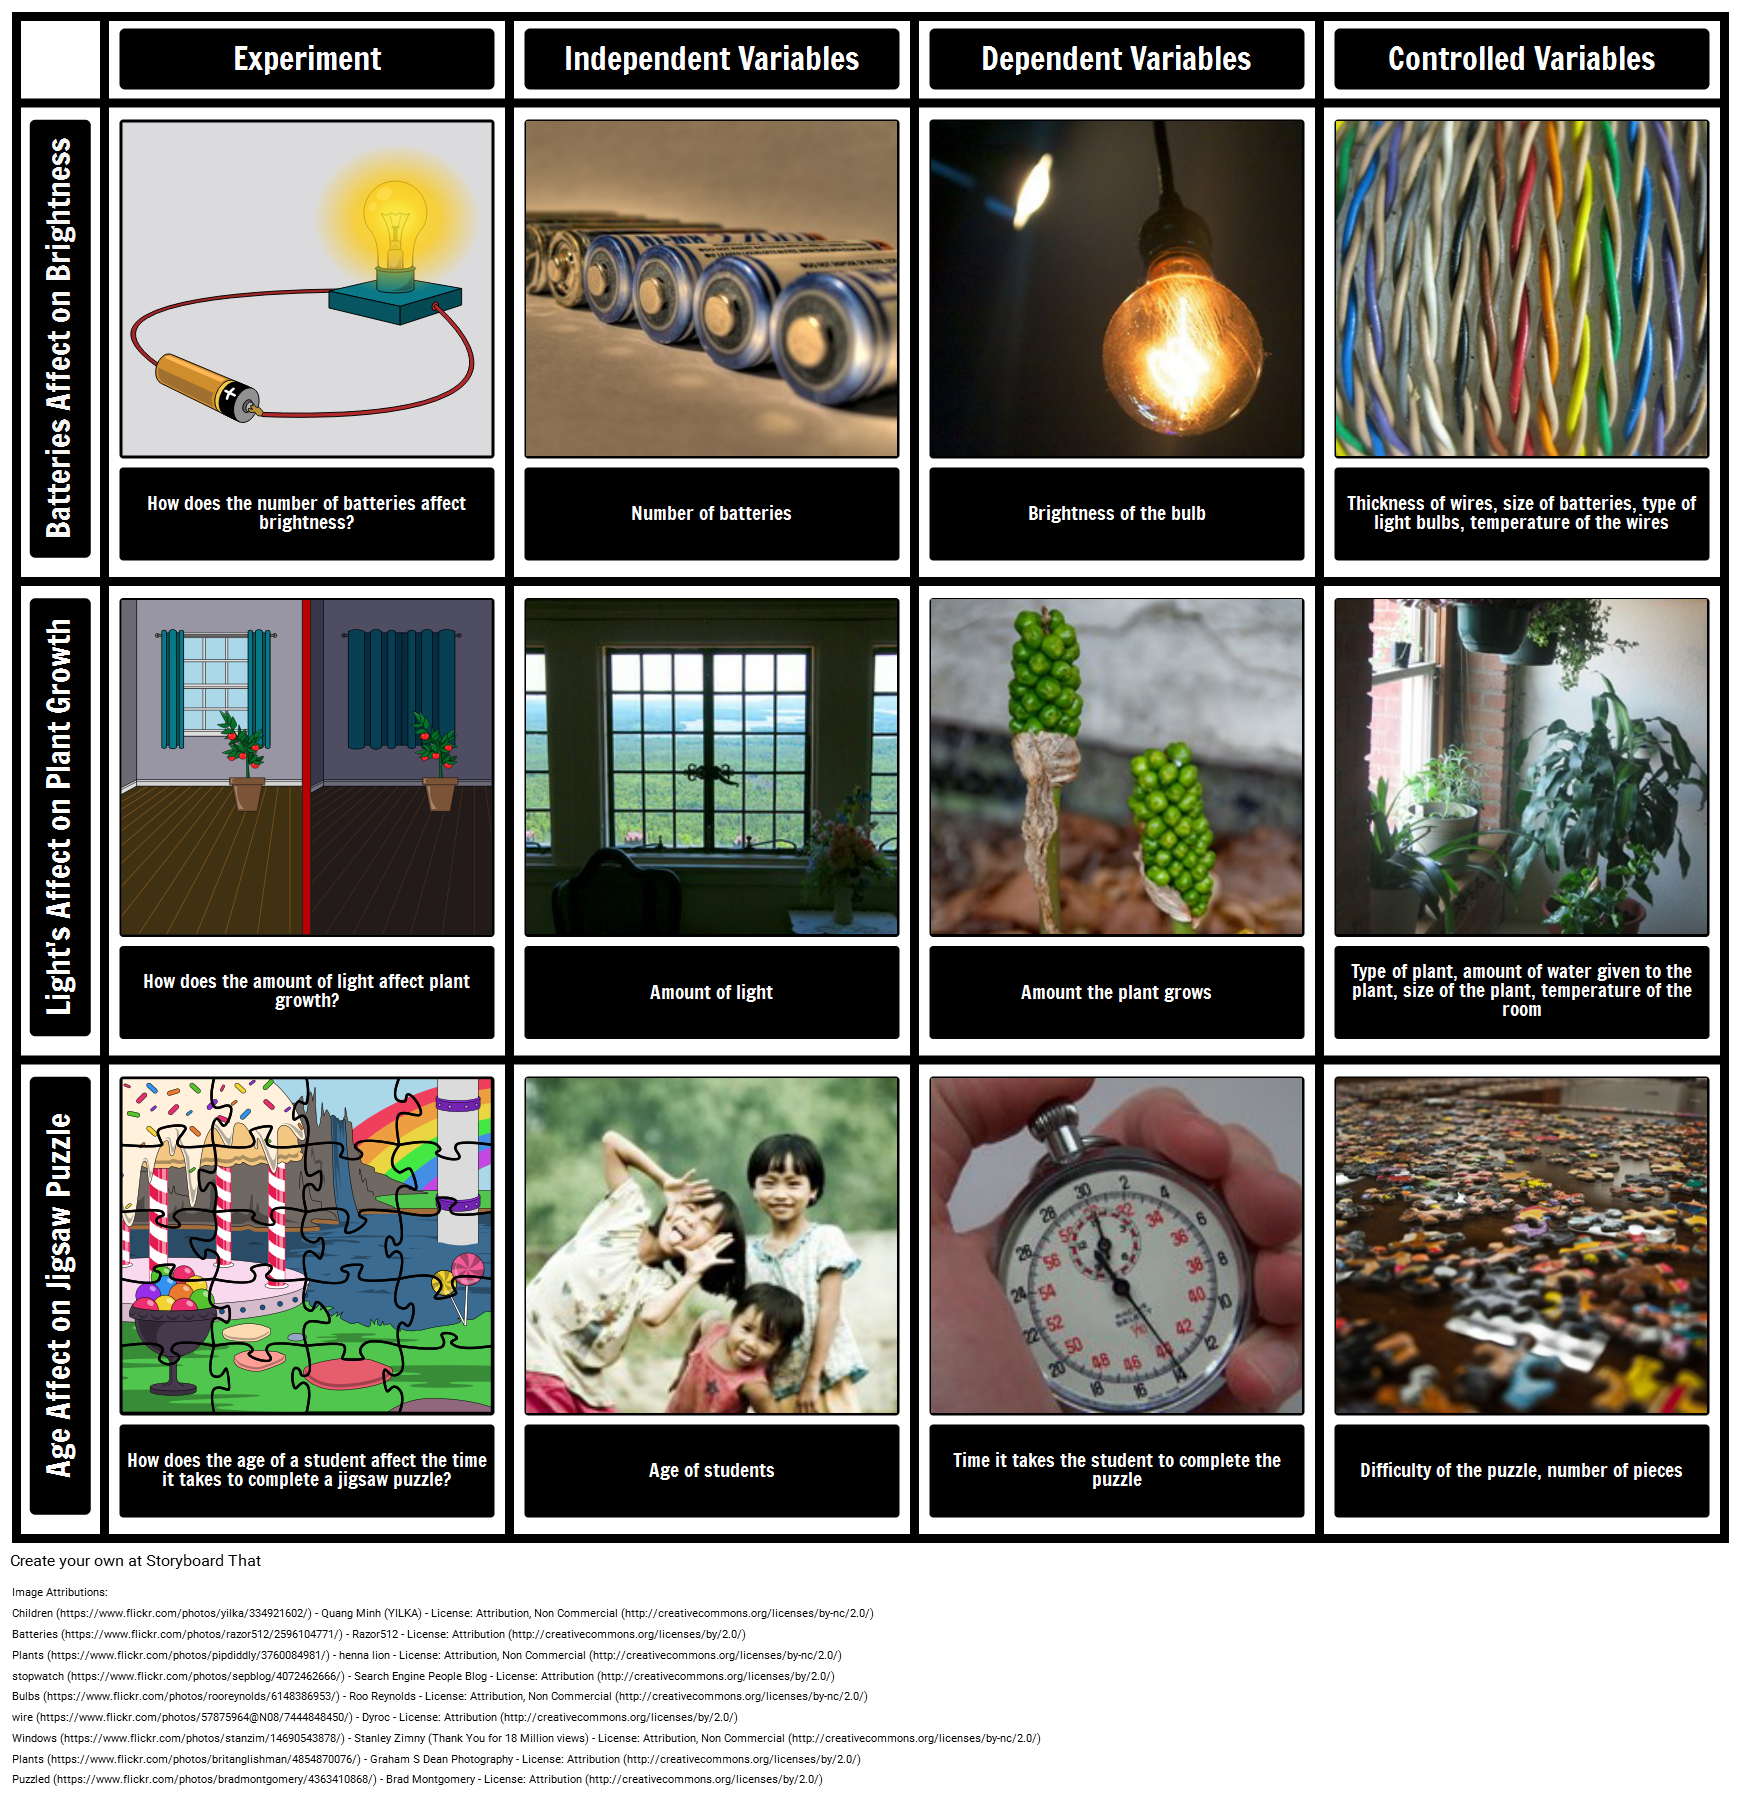
Below is an example of a Discussion Storyboard that can be used to get your students talking about variables in experimental design.
The three types of variables you will need to discuss with your students are dependent, independent, and controlled variables. To keep this simple, refer to these as "what you are going to measure", "what you are going to change", and "what you are going to keep the same". With more advanced students, you should encourage them to use the correct vocabulary.
Dependent variables are what is measured or observed by the scientist. These measurements will often be repeated because repeated measurements makes your data more reliable.
The independent variable is a variable that scientists decide to change to see what effect it has on the dependent variable. Only one is chosen because it would be difficult to figure out which variable is causing any change you observe.
Controlled variables are quantities or factors that scientists want to remain the same throughout the experiment. They are controlled to remain constant, so as to not affect the dependent variable. Controlling these allows scientists to see how the independent variable affects the dependent variable.
Use this example below in your lessons, or delete the answers and set it as an activity for students to complete on Storyboard That.
| How temperature affects the amount of sugar able to be dissolved in water | |
|---|---|
| Independent Variable | Water Temperature (Range 5 different samples at 10°C, 20°C, 30°C, 40°C and 50°C) |
| Dependent Variable | The amount of sugar that can be dissolved in the water, measured in teaspoons. |
| Controlled Variables |
|
6. Risk Assessment
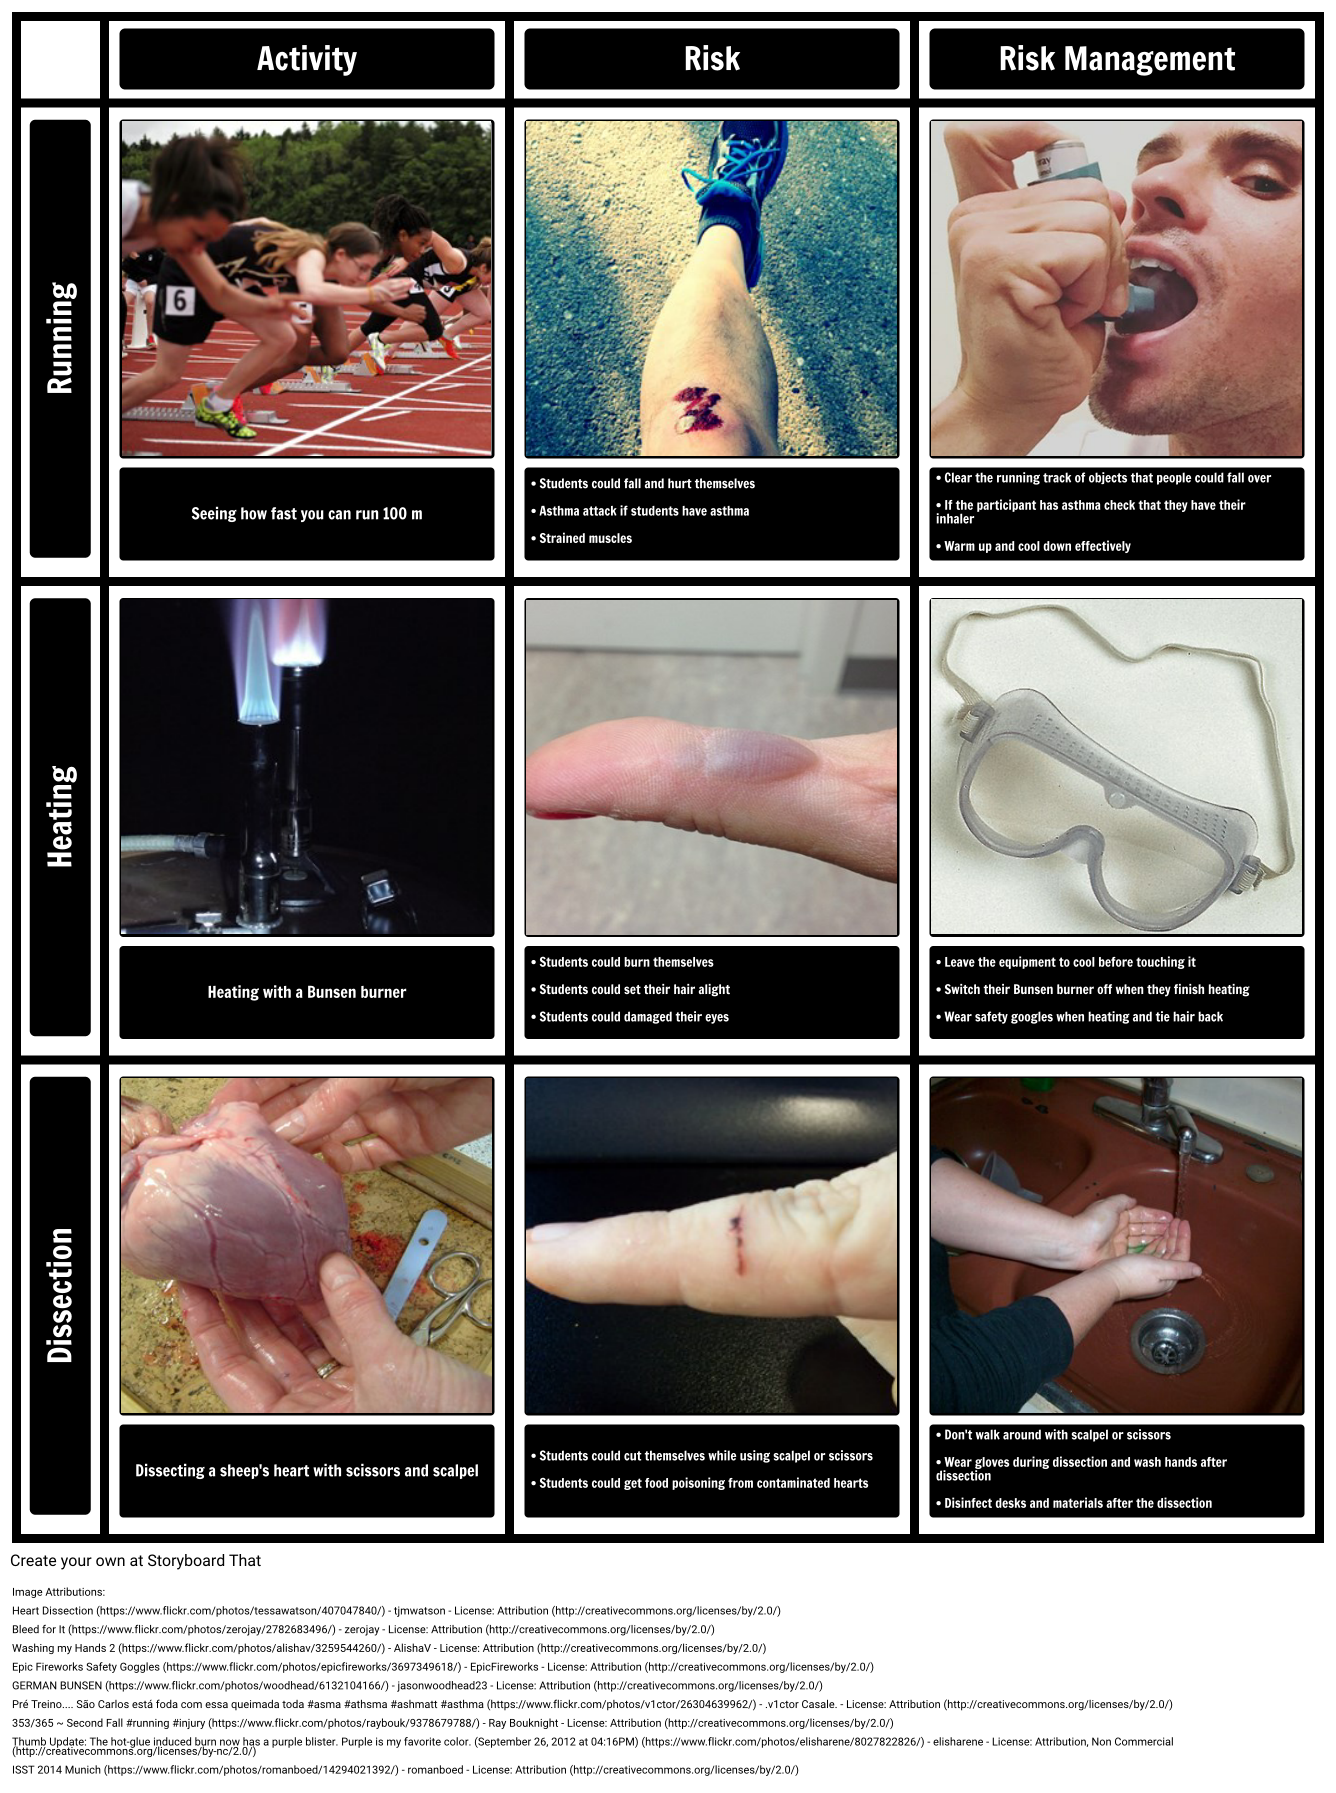
Ultimately this must be signed off on by a responsible adult, but it is important to get students to think about how they will keep themselves safe. In this part, students should identify potential risks and then explain how they are going to minimize risk. An activity to help students develop these skills is to get them to identify and manage risks in different situations. Using the storyboard below, get students to complete the second column of the T-chart by saying, "What is risk?", then explaining how they could manage that risk. This storyboard could also be projected for a class discussion.
7. Materials
In this section, students will list the materials they need for the experiments, including any safety equipment that they have highlighted as needing in the risk assessment section. This is a great time to talk to students about choosing tools that are suitable for the job. You are going to use a different tool to measure the width of a hair than to measure the width of a football field!
8. General Plan and Diagram
It is important to talk to students about reproducibility. They should write a procedure that would allow their experimental method to be reproduced easily by another scientist. The easiest and most concise way for students to do this is by making a numbered list of instructions. A useful activity here could be getting students to explain how to make a cup of tea or a sandwich. Act out the process, pointing out any steps they’ve missed.
For English Language Learners and students who struggle with written English, students can describe the steps in their experiment visually using Storyboard That.
Not every experiment will need a diagram, but some plans will be greatly improved by including one. Have students focus on producing clear and easy-to-understand diagrams.
9. Carry Out Experiment
Students then follow their plan and carry out the experiment. It is important that students collect their results in a meaningful and easy-to-understand way. Data is often recorded in a table, but could also be done with photographs, drawings of observations, or a combination. It may be helpful to have students write down any difficulties and problems they had when carrying out the experiment. This could help later with evaluating their experimental method.
It is important to mention that any experiments students design should be thoroughly risk-assessed by the responsible adult before letting any students carry out their practical work.
After completing the procedure of the experiment, students analyze the data, draw conclusions, and then share their results. Depending on the student level, this might be a formal lab report, graphs, class discussion, or other method.
Completed Examples
Resources and Experimental Design Examples
Using visual organizers is an effective way to get your students working as scientists in the classroom.
There are many ways to use these investigation planning tools to scaffold and structure students' work while they are working as scientists. Students can complete the planning stage on Storyboard That using the text boxes and diagrams, or you could print them off and have students complete them by hand. Another great way to use them is to project the planning sheet onto an interactive whiteboard and work through how to complete the planning materials as a group. Project it onto a screen and have students write their answers on sticky notes and put their ideas in the correct section of the planning document.
Very young learners can still start to think as scientists! They have loads of questions about the world around them and you can start to make a note of these in a mind map. Sometimes you can even start to ‘investigate’ these questions through play.
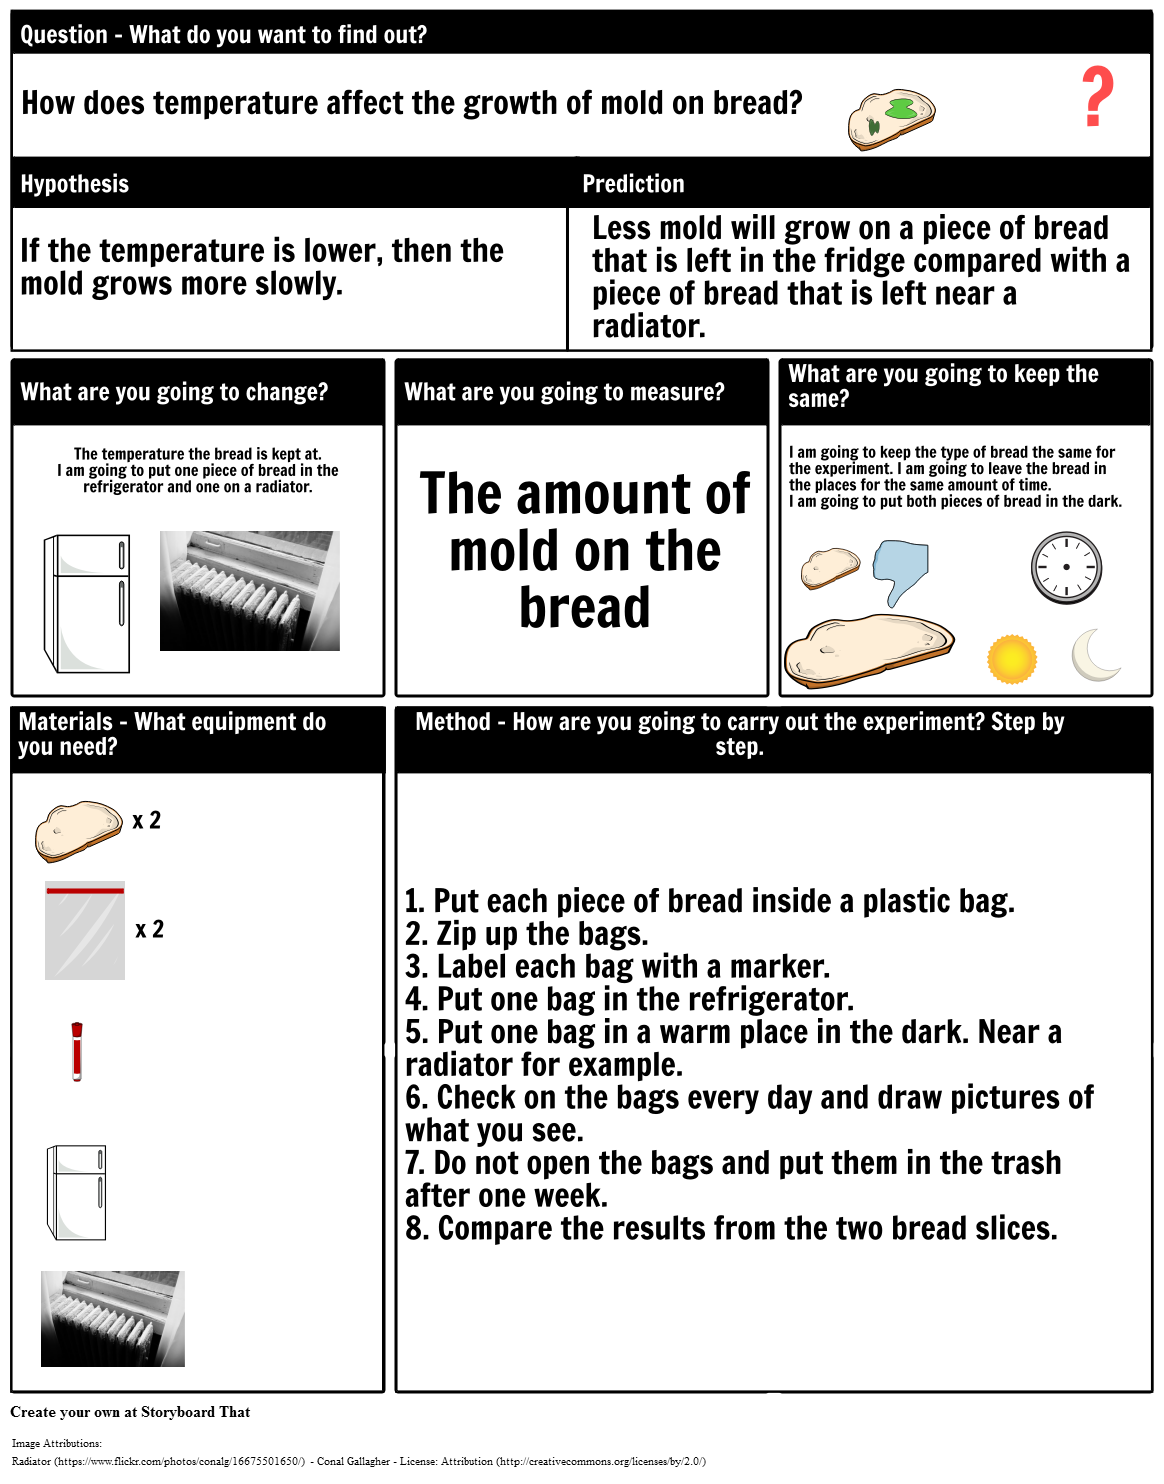
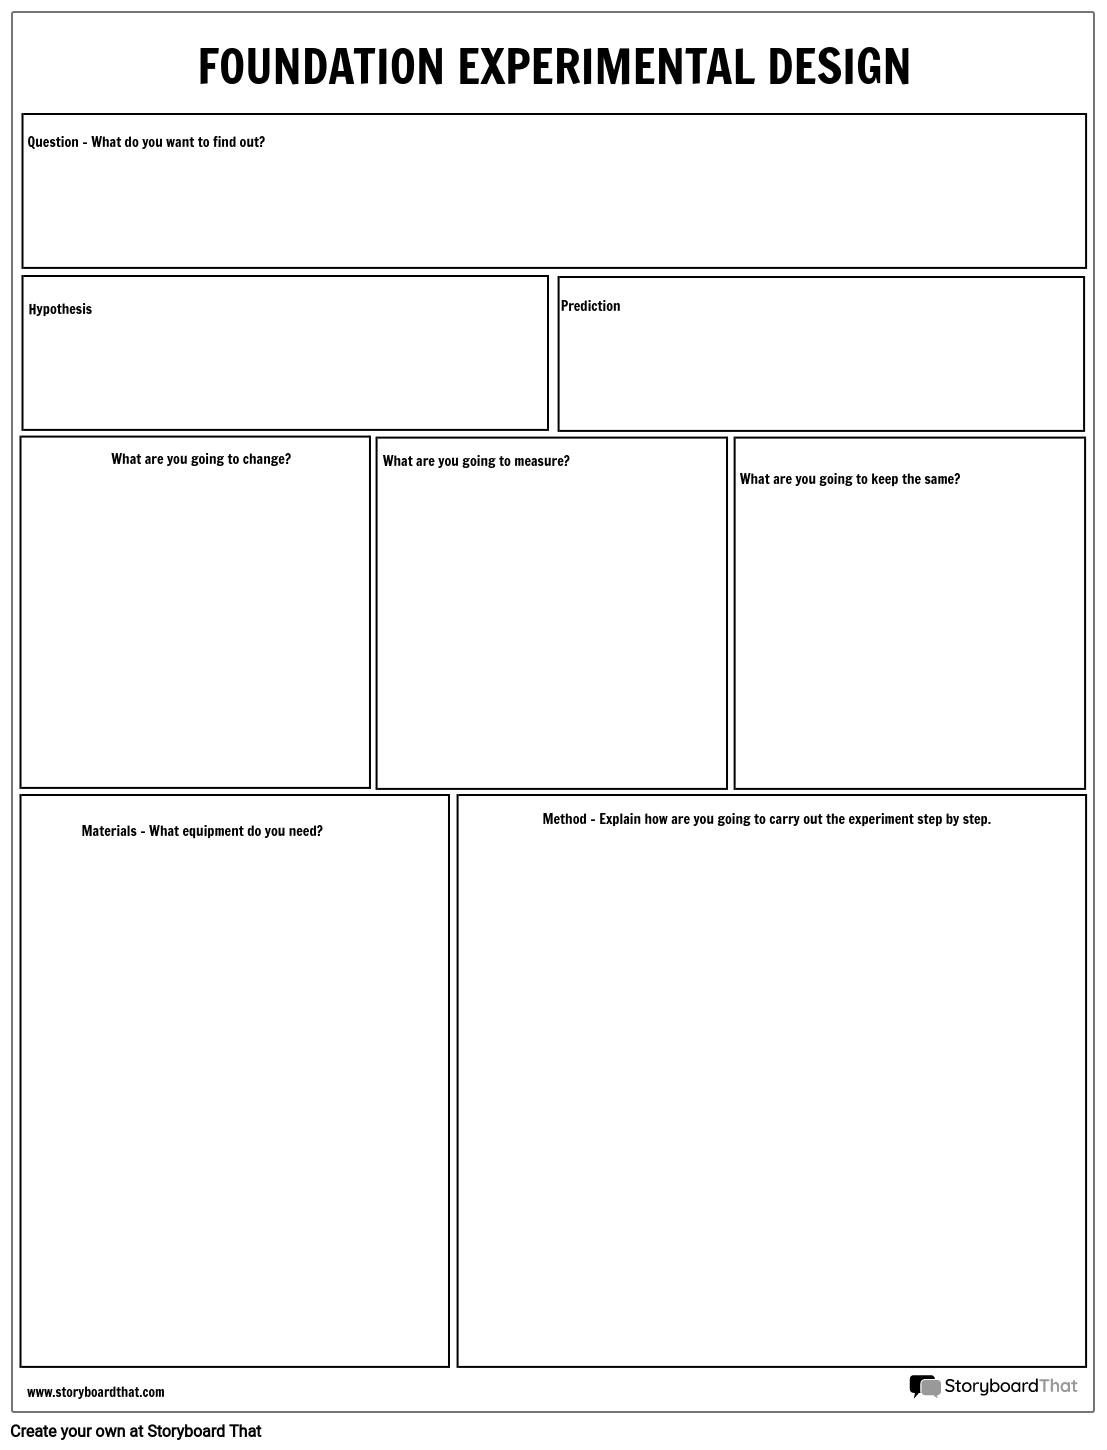
The foundation resource is intended for elementary students or students who need more support. It is designed to follow exactly the same process as the higher resources, but made slightly easier. The key difference between the two resources are the details that students are required to think about and the technical vocabulary used. For example, it is important that students identify variables when they are designing their investigations. In the higher version, students not only have to identify the variables, but make other comments, such as how they are going to measure the dependent variable. As well as the difference in scaffolding between the two levels of resources, you may want to further differentiate by how the learners are supported by teachers and assistants in the room.
Students could also be encouraged to make their experimental plan easier to understand by using graphics, and this could also be used to support ELLs.
Assessment
Students need to be assessed on their science inquiry skills alongside the assessment of their knowledge. Not only will that let students focus on developing their skills, but will also allow them to use their assessment information in a way that will help them improve their science skills. Using Quick Rubric, you can create a quick and easy assessment framework and share it with students so they know how to succeed at every stage. As well as providing formative assessment which will drive learning, this can also be used to assess student work at the end of an investigation and set targets for when they next attempt to plan their own investigation. The rubrics have been written in a way to allow students to access them easily. This way they can be shared with students as they are working through the planning process so students know what a good experimental design looks like.
| Proficient 13 Points | Emerging 7 Points | Beginning 0 Points | |
|---|---|---|---|
| Hypothesis | Hypothesis is clear and testable. | The hypothesis is not testable. | There is no hypothesis. |
| Prediction | A sensible prediction is made based on the hypothesis. | A prediction was made that is not based on the hypothesis. | No sensible prediction is made. |
| What you are going to measure and change? | Both what you are going to measure and what you are going to change are described. | What you are going to measure OR what you are going to change is described. | Neither what you are going to measure nor what you are going to change are described. |
| What you are going to keep the same? | A range of things you are going to keep the same are described. | Some of things you are going to keep the same are described. | Very few things you are going to keep the same are described. |
| Materials | All the materials you need are listed. | Some of the materials you need are listed. | Very few materials you need are listed. |
| Method and Diagram | Method is clear and concise. The experiment would be easily reproducible. Diagram (if needed) is clear and easy to understand. | Method is not clear and concise but understandable. Diagram (if needed) is confused but can be understood. | Method is jumbled and wouldn't produce results. Diagram (if needed) can't be understood. |
| Evidence of Effort | Work is well written and carefully thought out. | Work shows some evidence of effort. | Work shows little evidence of any effort. |
| Independence | No support from the teacher was needed. | Some support from the teacher was needed. | Lots of support was needed from the teacher. |
| Proficient 11 Points | Emerging 5 Points | Beginning 0 Points | |
|---|---|---|---|
| Hypothesis | Hypothesis is clear and testable with a clear explanation behind it. | The hypothesis is testable but there is no explanation behind it. | The hypothesis is not testable. |
| Prediction | A sensible prediction is made based on the hypothesis. | A prediction was made that is not based on the hypothesis. | No sensible prediction is made. |
| Variables | The independent variable is identified with details of the range and the repeats that will be made. The dependent variable is identified with a description of how it will be measured. | The independent and dependent variables are identified correctly. | The independent and dependent variables are not identified correctly. |
| Controlled Variables | A range of controlled variables are listed with a description of how they will be kept constant. | Some controlled variables are listed. | Very few controlled variables are listed. |
| Risk Assessment | A range of risks are identified with suggestions on how to manage them. | Some risks are identified with suggestions on how to manage them. | Very few risks are identified and managed. |
| Materials | All materials are listed with an explanation of why each item is needed. | Some materials are listed with an explanation of why each item is needed. | Very few materials are listed with no explanations of why they are needed. |
| Method and Diagram | Method is clear and concise. The experiment would be easily reproducible. Diagram (if needed) is clear and easy to understand. | Method is not clear and concise but understandable. Diagram (if needed) is confused but can be understood. | Method is jumbled and wouldn't produce results. Diagram (if needed) can't be understood. |
| Evidence of Effort | Work is well written and carefully thought out. | Work shows some evidence of effort. | Work shows little evidence of any effort. |
| Independence | No support from the teacher was needed. | Some support from the teacher was needed. | Lots of support was needed from the teacher. |
Printable Resources
Related Activities
Additional Worksheets
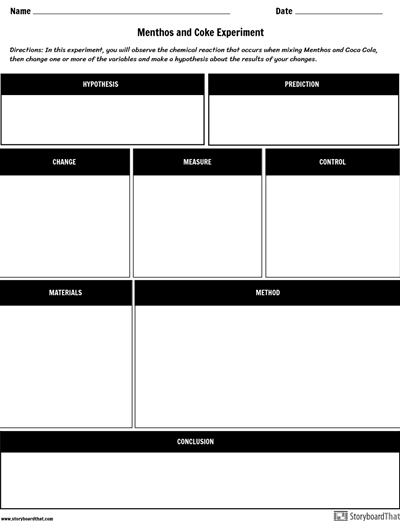
If you're looking to add additional projects or continue to customize worksheets, take a look at several template pages we've compiled for you below. Each worksheet can be copied and tailored to your projects or students! Students can also be encouraged to create their own if they want to try organizing information in an easy to understand way.
How to Teach Students the Design of Experiments
Encourage questioning and curiosity
Foster a culture of inquiry by encouraging students to ask questions about the world around them.
Formulate testable hypotheses
Teach students how to develop hypotheses that can be scientifically tested. Help them understand the difference between a hypothesis and a question.
Provide scientific background
Help students understand the scientific principles and concepts relevant to their hypotheses. Encourage them to draw on prior knowledge or conduct research to support their hypotheses.
Identify variables
Teach students about the three types of variables (dependent, independent, and controlled) and how they relate to experimental design. Emphasize the importance of controlling variables and measuring the dependent variable accurately.
Plan and diagram the experiment
Guide students in developing a clear and reproducible experimental procedure. Encourage them to create a step-by-step plan or use visual diagrams to illustrate the process.
Carry out the experiment and analyze data
Support students as they conduct the experiment according to their plan. Guide them in collecting data in a meaningful and organized manner. Assist them in analyzing the data and drawing conclusions based on their findings.
Frequently Asked Questions about Experimental Design for Students
What are some common experimental design tools and techniques that students can use?
Common experimental design tools and techniques that students can use include random assignment, control groups, blinding, replication, and statistical analysis. Students can also use observational studies, surveys, and experiments with natural or quasi-experimental designs. They can also use data visualization tools to analyze and present their results.
How can experimental design help students develop critical thinking skills?
Experimental design helps students develop critical thinking skills by encouraging them to think systematically and logically about scientific problems. It requires students to analyze data, identify patterns, and draw conclusions based on evidence. It also helps students to develop problem-solving skills by providing opportunities to design and conduct experiments to test hypotheses.
How can experimental design be used to address real-world problems?
Experimental design can be used to address real-world problems by identifying variables that contribute to a particular problem and testing interventions to see if they are effective in addressing the problem. For example, experimental design can be used to test the effectiveness of new medical treatments or to evaluate the impact of social interventions on reducing poverty or improving educational outcomes.
What are some common experimental design pitfalls that students should avoid?
Common experimental design pitfalls that students should avoid include failing to control variables, using biased samples, relying on anecdotal evidence, and failing to measure dependent variables accurately. Students should also be aware of ethical considerations when conducting experiments, such as obtaining informed consent and protecting the privacy of research subjects.
- 353/365 ~ Second Fall #running #injury • Ray Bouknight • License Attribution (http://creativecommons.org/licenses/by/2.0/)
- Always Writing • mrsdkrebs • License Attribution (http://creativecommons.org/licenses/by/2.0/)
- Batteries • Razor512 • License Attribution (http://creativecommons.org/licenses/by/2.0/)
- Bleed for It • zerojay • License Attribution (http://creativecommons.org/licenses/by/2.0/)
- Bulbs • Roo Reynolds • License Attribution, Non Commercial (http://creativecommons.org/licenses/by-nc/2.0/)
- Change • dominiccampbell • License Attribution (http://creativecommons.org/licenses/by/2.0/)
- Children • Quang Minh (YILKA) • License Attribution, Non Commercial (http://creativecommons.org/licenses/by-nc/2.0/)
- Danger • KatJaTo • License Attribution (http://creativecommons.org/licenses/by/2.0/)
- draw • Asja. • License Attribution (http://creativecommons.org/licenses/by/2.0/)
- Epic Fireworks Safety Goggles • EpicFireworks • License Attribution (http://creativecommons.org/licenses/by/2.0/)
- GERMAN BUNSEN • jasonwoodhead23 • License Attribution (http://creativecommons.org/licenses/by/2.0/)
- Heart Dissection • tjmwatson • License Attribution (http://creativecommons.org/licenses/by/2.0/)
- ISST 2014 Munich • romanboed • License Attribution (http://creativecommons.org/licenses/by/2.0/)
- Lightbulb! • Matthew Wynn • License Attribution (http://creativecommons.org/licenses/by/2.0/)
- Mini magnifying glass • SkintDad.co.uk • License Attribution, Non Commercial (http://creativecommons.org/licenses/by-nc/2.0/)
- Plants • henna lion • License Attribution, Non Commercial (http://creativecommons.org/licenses/by-nc/2.0/)
- Plants • Graham S Dean Photography • License Attribution (http://creativecommons.org/licenses/by/2.0/)
- Pré Treino.... São Carlos está foda com essa queimada toda #asma #athsma #ashmatt #asthma • .v1ctor Casale. • License Attribution (http://creativecommons.org/licenses/by/2.0/)
- puzzle • olgaberrios • License Attribution (http://creativecommons.org/licenses/by/2.0/)
- Puzzled • Brad Montgomery • License Attribution (http://creativecommons.org/licenses/by/2.0/)
- Question Mark • ryanmilani • License Attribution (http://creativecommons.org/licenses/by/2.0/)
- Radiator • Conal Gallagher • License Attribution (http://creativecommons.org/licenses/by/2.0/)
- Red Tool Box • marinetank0 • License Attribution (http://creativecommons.org/licenses/by/2.0/)
- Remote Control • Sean MacEntee • License Attribution (http://creativecommons.org/licenses/by/2.0/)
- stopwatch • Search Engine People Blog • License Attribution (http://creativecommons.org/licenses/by/2.0/)
- Thinking • Caramdir • License Attribution, Non Commercial (http://creativecommons.org/licenses/by-nc/2.0/)
- Thumb Update: The hot-glue induced burn now has a purple blister. Purple is my favorite color. (September 26, 2012 at 04:16PM) • elisharene • License Attribution, Non Commercial (http://creativecommons.org/licenses/by-nc/2.0/)
- Washing my Hands 2 • AlishaV • License Attribution (http://creativecommons.org/licenses/by/2.0/)
- Windows • Stanley Zimny (Thank You for 18 Million views) • License Attribution, Non Commercial (http://creativecommons.org/licenses/by-nc/2.0/)
- wire • Dyroc • License Attribution (http://creativecommons.org/licenses/by/2.0/)
© 2024 - Clever Prototypes, LLC - All rights reserved.
StoryboardThat is a trademark of Clever Prototypes, LLC, and Registered in U.S. Patent and Trademark Office

