What is a Progress Bar Infographic?
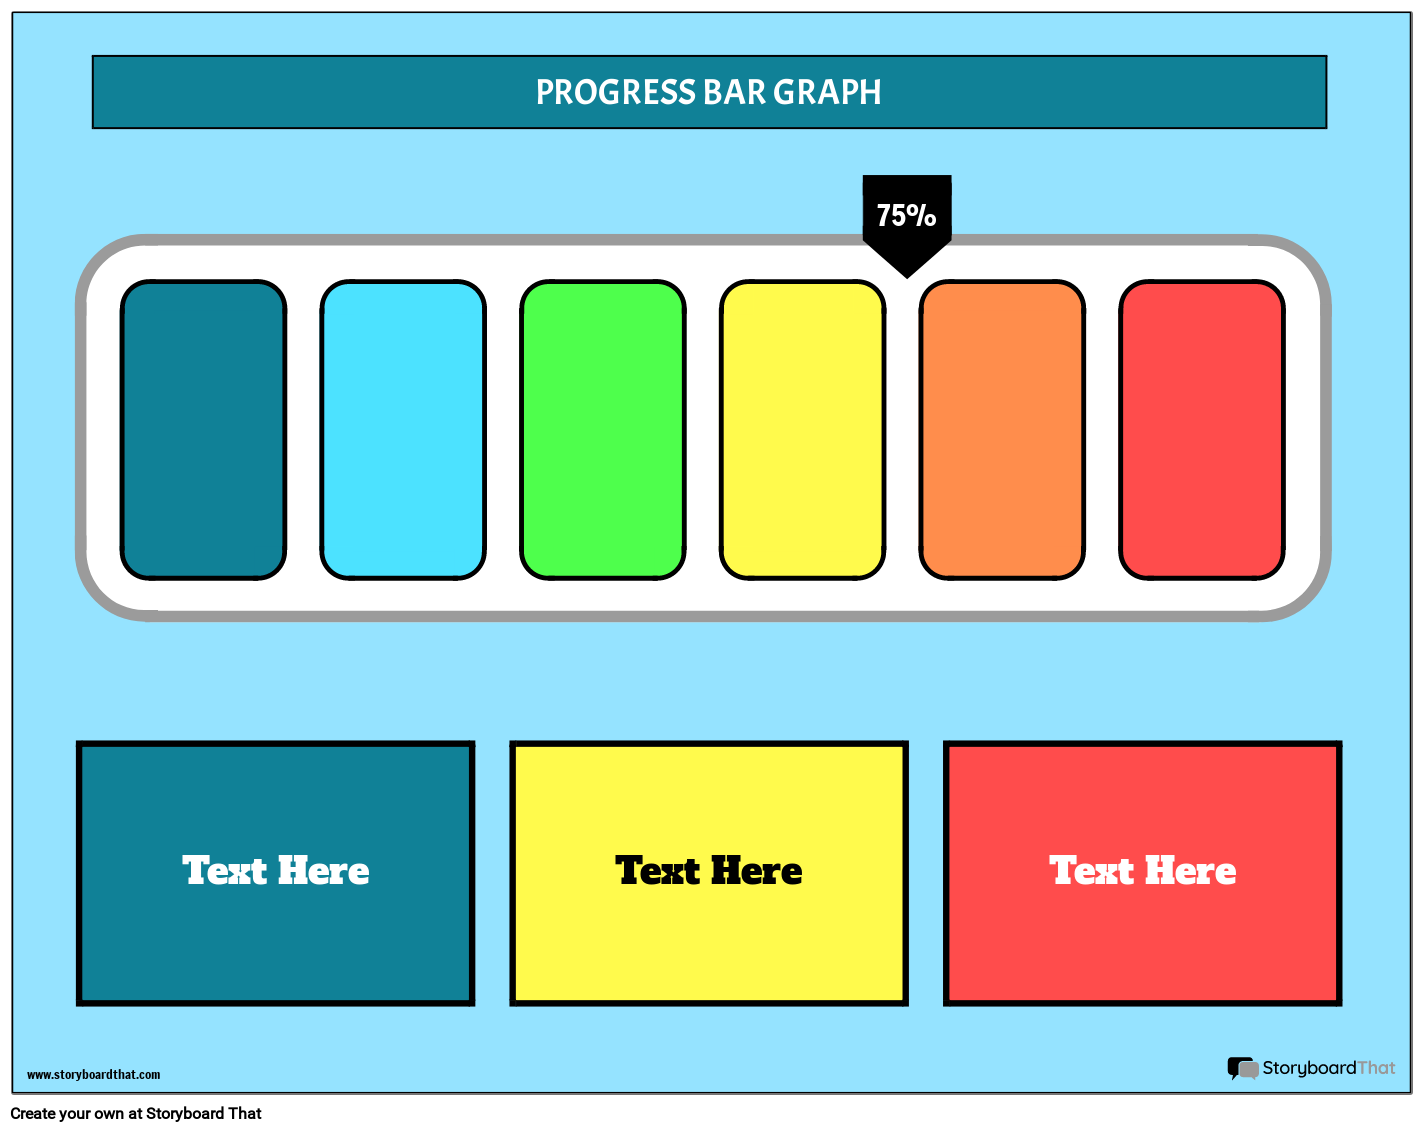
A progress bar infographic is a visual representation of progress towards a particular goal or task. It typically consists of a horizontal bar divided into sections, with each section representing a certain amount of progress. The bar may be color-coded or include icons or symbols to help communicate the information more effectively.
How are Progress Bar Infographics Used?
Progress bar infographics can be used in a variety of ways, including:
- Tracking progress towards personal or professional goals
- Communicating progress to stakeholders or clients
- Visualizing project timelines and milestones
- Demonstrating progress in fundraising or donation campaigns
- Providing feedback to users in software or app interfaces
Benefits of Using a Progress Bar Infographic
Some benefits of using a progress bar infographic include:
- Communicating Progress More Effectively: A progress bar infographic makes it easy to understand how much progress has been made towards a particular goal.
- Motivating Individuals or Teams: Seeing progress can be motivating, and a progress bar infographic can help individuals or teams stay focused and motivated towards achieving their goal.
- Encouraging Transparency: By sharing progress with stakeholders or clients, a progress bar infographic can help encourage transparency and build trust.
- Highlighting Areas for Improvement: If progress is slower than anticipated, a progress bar infographic can help highlight areas that may need more attention or resources.
Included in a Progress Bar Infographic
A progress bar infographic typically includes the following elements:
- A horizontal bar divided into sections
- Labels or icons to indicate what each section represents
- A percentage or numerical value to indicate how much progress has been made
- Color coding or other visual cues to make the information easy to understand
- Optional text or images to provide additional context or information
3 Tips for Creating a Progress Bar Infographic
Set Your Goal
First things first: what are you working towards? Make the goal tough, but realistic. The team should know that they need to work hard to hit this goal, and as a business manager, set expectations so that even if they don't hit it, an element of success is still achieved.
Set Checkpoints
Set checkpoints or "mini goals" along the way. It's important to keep the team happy and motivated and a great way to do this is by setting checkpoints. These checkpoints will serve as small victories along the progress bar as the team works towards the main goal.
Show What is Considered Success
Finally, show at which level success is achieved. Maybe your main goal is to hit 1 million dollars in sales, but as the progress bar gets closer to the 1M mark, have it change colors. At maybe 75-80% of your goal, you could mark this as a success. This lets them know that they've done a great job, but there's still opportunity to do even better!
Frequently Asked Questions About Progress Bar Infographics
What's the best way to display progress in a progress bar infographic?
There are several ways to display progress in a progress bar infographic, including:
- Using color coding to indicate progress (e.g., green for completed, yellow for in progress, and red for not started)
- Using icons or symbols to represent different stages of progress
- Displaying a percentage or numerical value to show how much progress has been made
Ultimately, the best way to display progress will depend on the specific goal or task you're tracking and the audience you're communicating with.
What types of goals or tasks are best suited for a progress bar infographic?
Progress bar infographics can be used for a wide range of goals and tasks, from personal fitness goals to business projects to fundraising campaigns. Any goal or task that can be measured in terms of progress towards completion is a good candidate for a progress bar infographic.
Can a progress bar infographic be interactive?
Yes, a progress bar infographic can be made interactive by adding clickable elements or animation. For example, a progress bar infographic tracking progress towards a fundraising goal could include a clickable button to make a donation, or a progress bar infographic tracking progress on a software development project could include an animated graphic showing how the project has evolved over time.
© 2026 - Clever Prototypes, LLC - All rights reserved.
StoryboardThat is a trademark of Clever Prototypes, LLC, and Registered in U.S. Patent and Trademark Office


