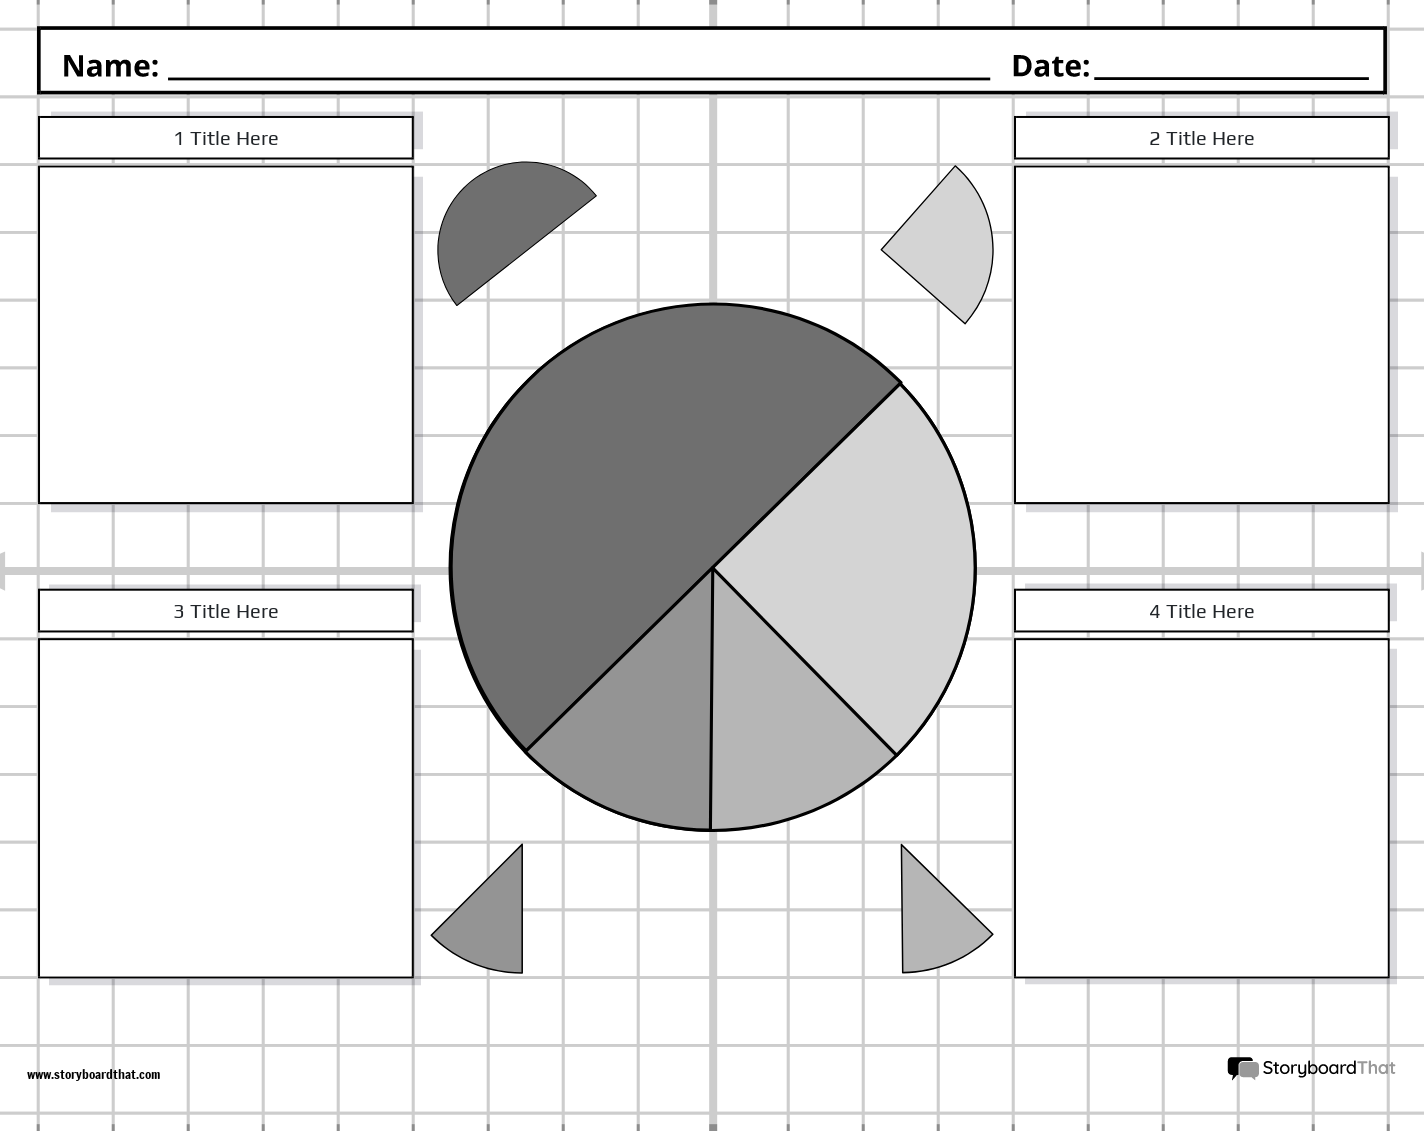
Customize Pie Chart Templates
If you're assigning this to your students, copy the worksheet to your account and save. When creating an assignment, just select it as a template!

What are Pie Charts?
Pie charts are also known as circle graphs or pie graphs. They are a type of graph used to show the distribution of data in a circular format. They are used to compare parts of a whole and are often used to display percentages or fractions.
Pie charts or circle graphs are a great way to visually represent data in a clear and concise way. By using a circle chart circle, or other example templates, students can easily compare different categories and see how they relate to the whole. For this reason, pie graphs are often used in business, science, and math.
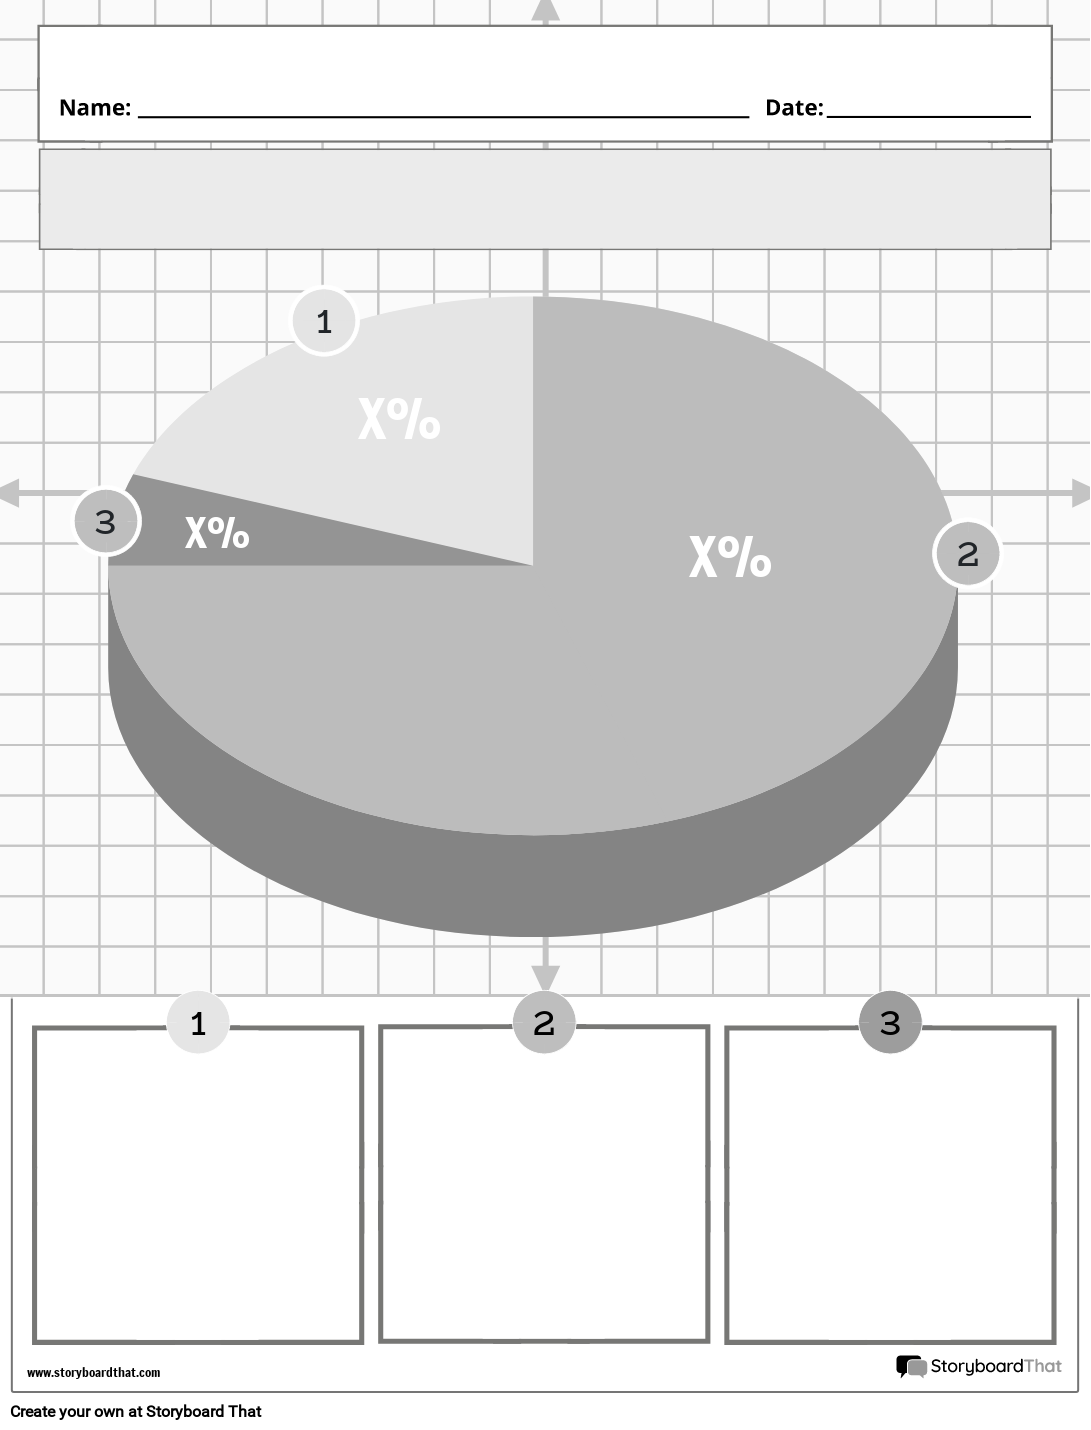
There are several types of these charts that students can learn about, such as a 3D pie chart and and a doughnut chart. By introducing different types of pie charts, students can learn how to use them to represent data in various ways.
Using Pie Chart Worksheets in the Classroom
Circle graph worksheets are an excellent way to engage students and help them understand the concept of pie graphs. These worksheets can be tailored to different grade levels, depending on the complexity of the questions based on the data provided in the table. It is a useful instructional tool in the classroom because it allows students to quickly understand and analyze data, compare and contrast different sets of data, and identify patterns and trends. For example, younger students may be asked to interpret pie graphs with whole numbers, while older students may be asked to calculate percentages or fractions.
When using pie chart worksheets in the classroom, it's important to cater to the needs of special needs students. This can be done by using larger font sizes, providing clear instructions, and using high-quality images. Our templates can also be modified to cater to the specific needs of each student, such as using simplified language or providing additional support for calculations.
Pie charts are useful tools for using in the classroom for several reasons. They are:
- Easy to understand
- Efficient
- Versatile
- Interactive
- Real-world application
- Visual Representation
Incorporating Pie Graphs as an Instructional Tool in Different Subjects
Math
Fractions and Percentages: Pie charts are an excellent tool for teaching fractions and percentages. Students can easily see how a whole is divided into parts and calculate the percentage and fraction of each part.
Angles: They are also useful for teaching angles. Students can learn about how angles correspond to the proportion of each category in the chart.
Science
Data Analysis: Pie charts are a useful tool for analyzing and interpreting data in science experiments. Students can use them to represent the data collected from experiments and draw conclusions about the results.
Social Studies
Historical Events: Pie charts can be used to represent historical events and data, such as population distribution, economic data, or political events.
Geography: They can also be used in geography to represent different data, such as population demographics, climate data, or land use data.
Language Arts
Literature Analysis: They can be used to represent data in literature analysis. For example, a pie chart can be used to represent the frequency of different types of characters in a novel or the use of different literary devices.
Pie Charts by Grade Level
Elementary School
Teach Basic Fractions Using Pie Charts: Use simple pie graph worksheets to introduce the concept of fractions to young students.
Create a Chart of Favorite Foods: Have students create a pie chart representing their favorite foods and discuss the results as a class.
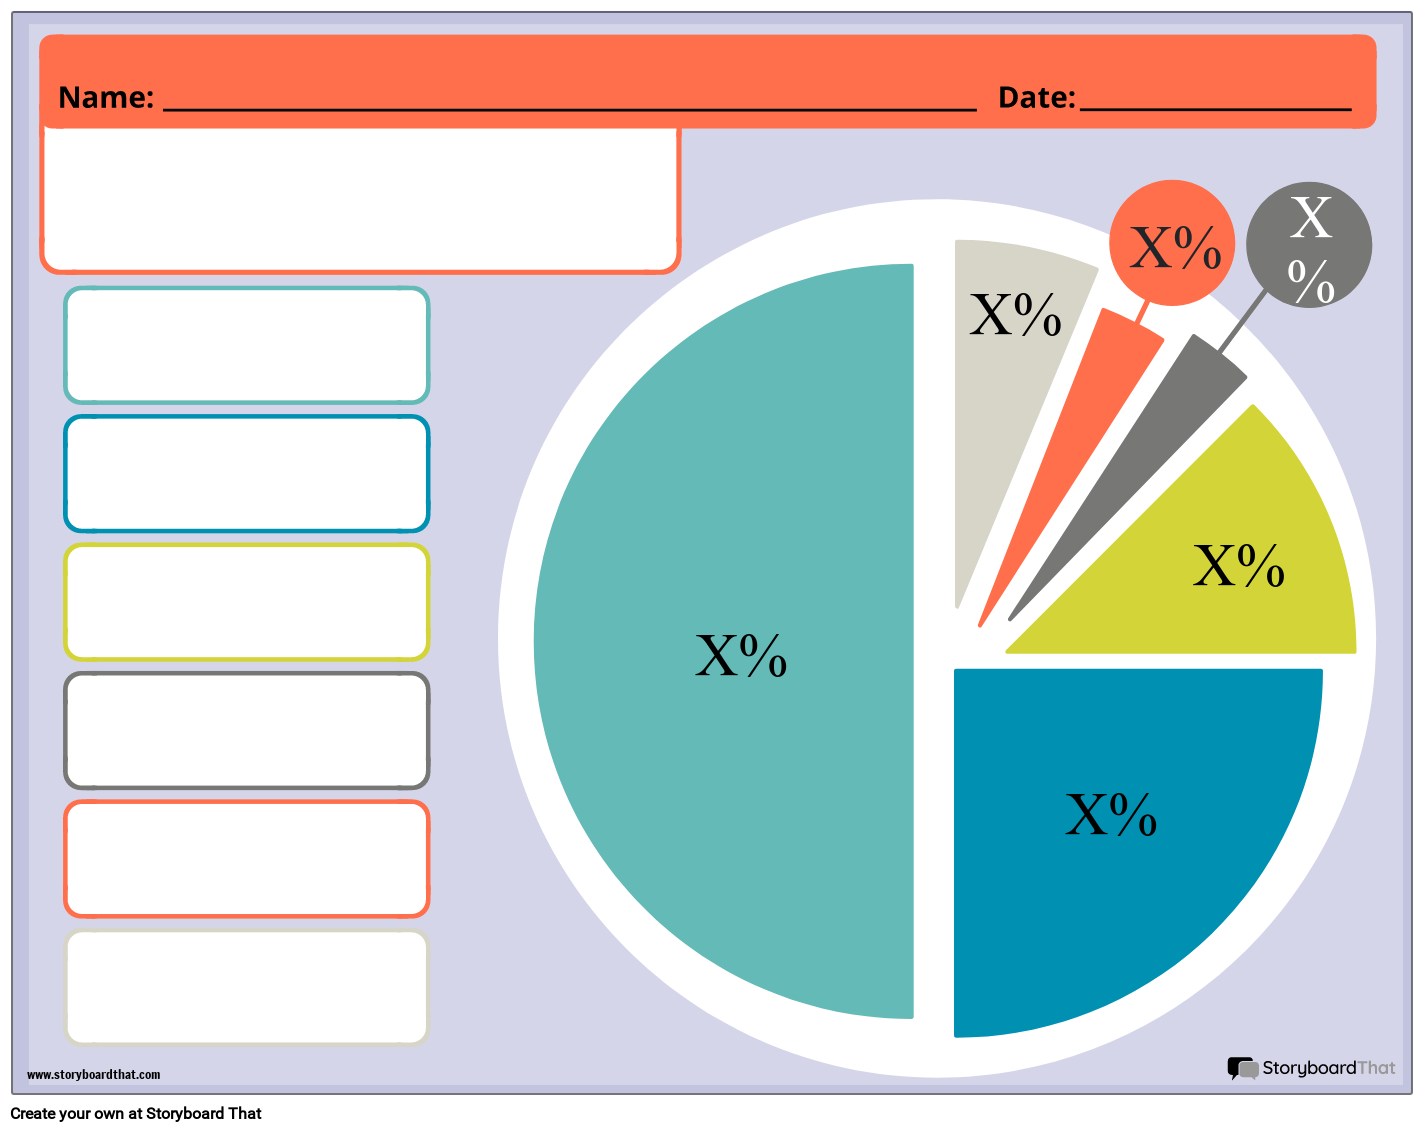
Color Pie Chart: One simple template teachers can use at this level is the color pie chart. Used at this level makes it easier for students to understand and interpret the data. By using different colors for each segment, students can quickly identify which category represents which data.
Middle School
Analyze Data from a Science Experiment: Use a pie chart to analyze and interpret data from a science experiment and draw conclusions about the results.
Use Pie Charts to Represent Historical Data: Have students create charts to represent historical data, such as population growth or migration patterns.
High School
Create a Pie Chart of Demographic Data: Have students create a chart representing demographic data, such as age, gender, or ethnicity.
Use to Represent Economic Data: Have students create charts to represent economic data, such as income distribution or industry growth.
Overall, our charts are a versatile tool that can be used in various subjects and grade levels to teach data analysis, interpretation, and representation. By using pie graph worksheets, teachers can help students better understand complex data and draw conclusions from it.
Some common mistakes or pitfalls to avoid when using pie charts as instructional tools in the classroom include using too many slices, using unclear or confusing labels, and using them for data that cannot be effectively represented in this format.
Additional Storyboard That Resources and Free Printables
Looking for a quick and easy way to reinforce classroom concepts and a pie chart maker online? Storyboard That is the free pie chart generator you need.
How to Make a Pie Chart Worksheet
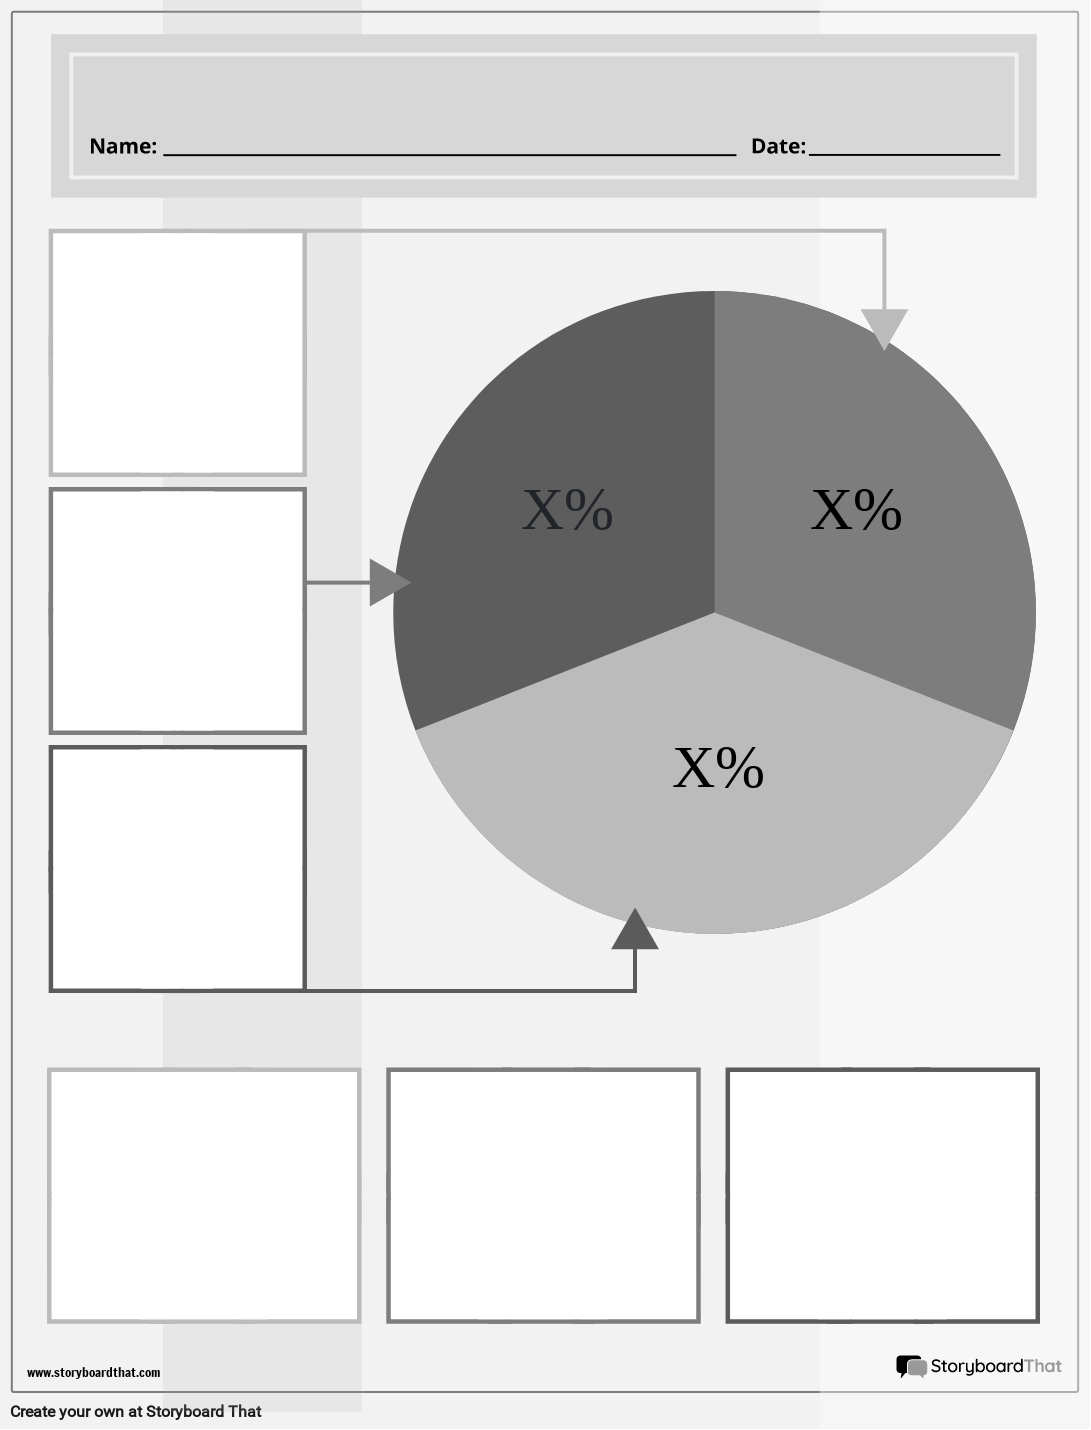
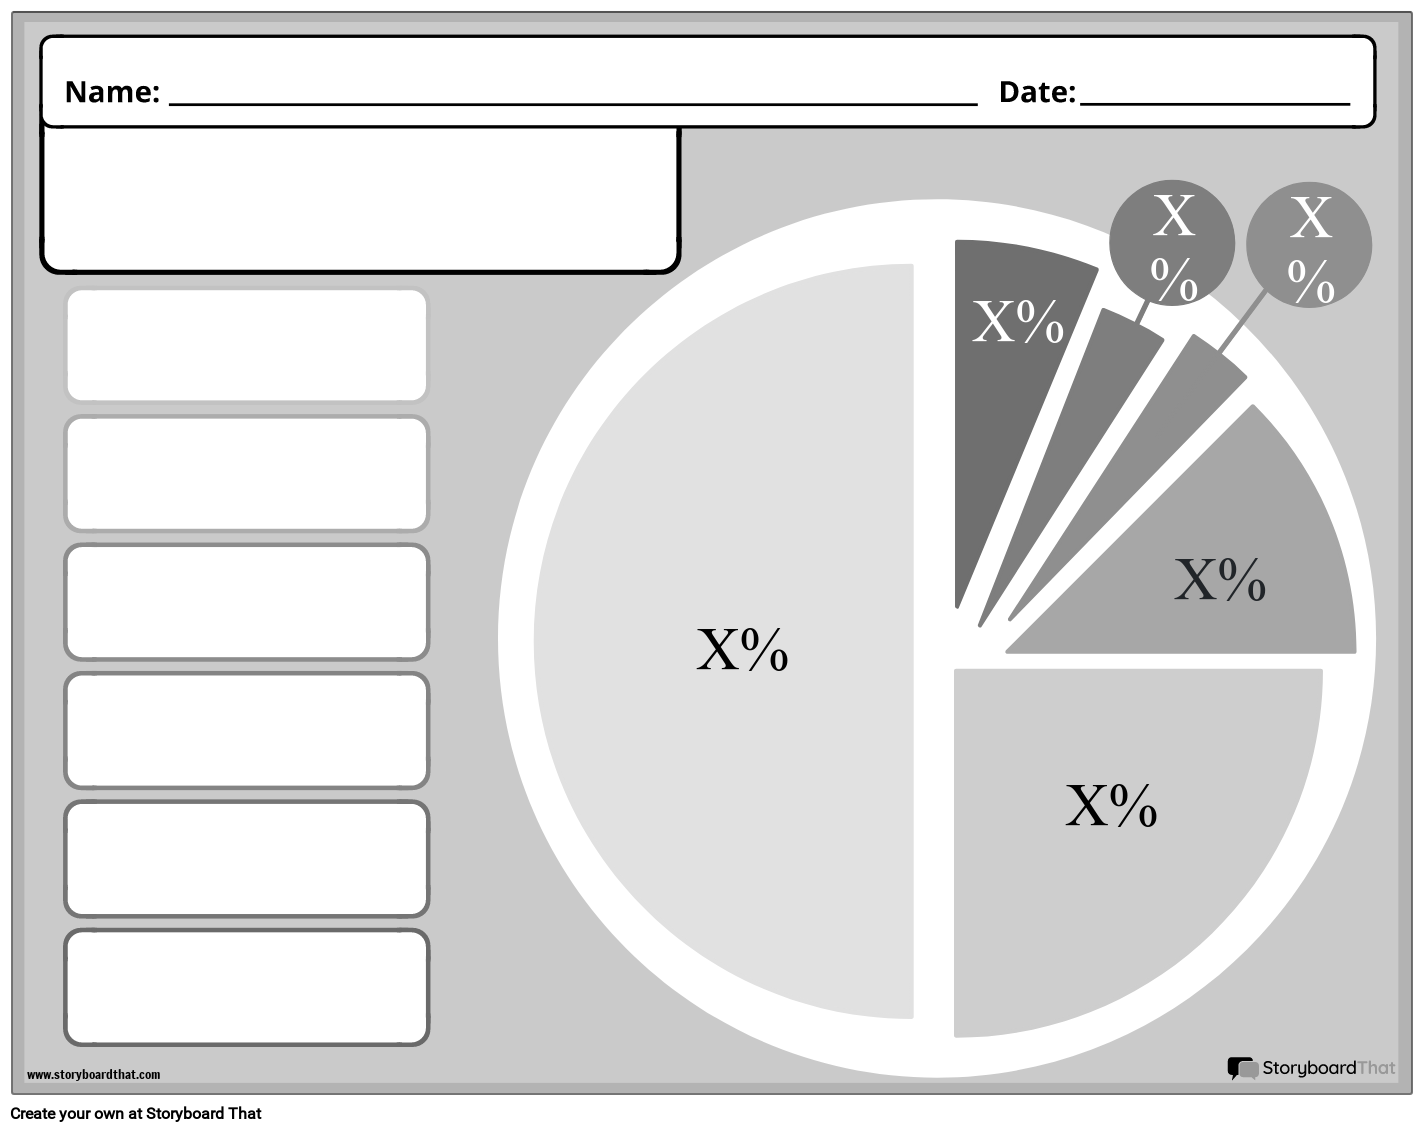
Choose One of the Premade Templates
We have color, black and white, portrait, or landscape templates. Take a look at our colorful example for inspiration!
Click on "Copy Template"
Once you do this, you will be directed to the storyboard creator.
Give Your Worksheet a Name!
Be sure to call it something related to the topic so that you can easily find it in the future.
Edit Your Worksheet
This is where you will include directions, specific questions and images, and make any aesthetic changes that you would like. The options are endless!
Click "Save and Exit"
When you are finished with your worksheet, click this button in the lower right hand corner to exit your storyboard.
Next Steps
From here you can print, download as a PDF, attach it to an assignment and use it digitally, and more!
Happy Creating!
Frequently Asked Questions about Pie Charts
What is a pie chart, and how can it be used as an instructional tool in the classroom?
A pie chart is a circular chart that is used to represent data in a visual format. It is a useful instructional tool in the classroom because it allows students to quickly understand and analyze data, compare and contrast different sets of data, and identify patterns and trends.
What are some benefits of using these charts in the classroom, and how can they help students learn?
Pie charts offer several benefits as an instructional tool in the classroom. They provide a clear and concise visual representation of data, making it easier for students to understand and remember information. They can also help students to develop their analytical and critical thinking skills by allowing them to compare and contrast different sets of data and identify patterns and trends.
What are some common mistakes or pitfalls to avoid when using pie charts as instructional tools in the classroom?
Pie chart design is essential when creating effective instructional tools for the classroom. Some common mistakes or pitfalls to avoid when using pie charts as instructional tools in the classroom include using too many slices, using unclear or confusing labels, and using these types of charts for data that cannot be effectively represented in this format.
© 2026 - Clever Prototypes, LLC - All rights reserved.
StoryboardThat is a trademark of Clever Prototypes, LLC, and Registered in U.S. Patent and Trademark Office


