Customize Social Studies Graphic Organizer Templates
If you're assigning this to your students, copy the worksheet to your account and save. When creating an assignment, just select it as a template!

What are Social Studies Graphic Organizers?
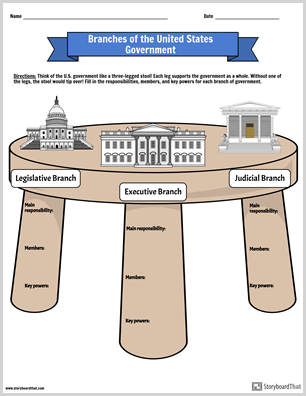
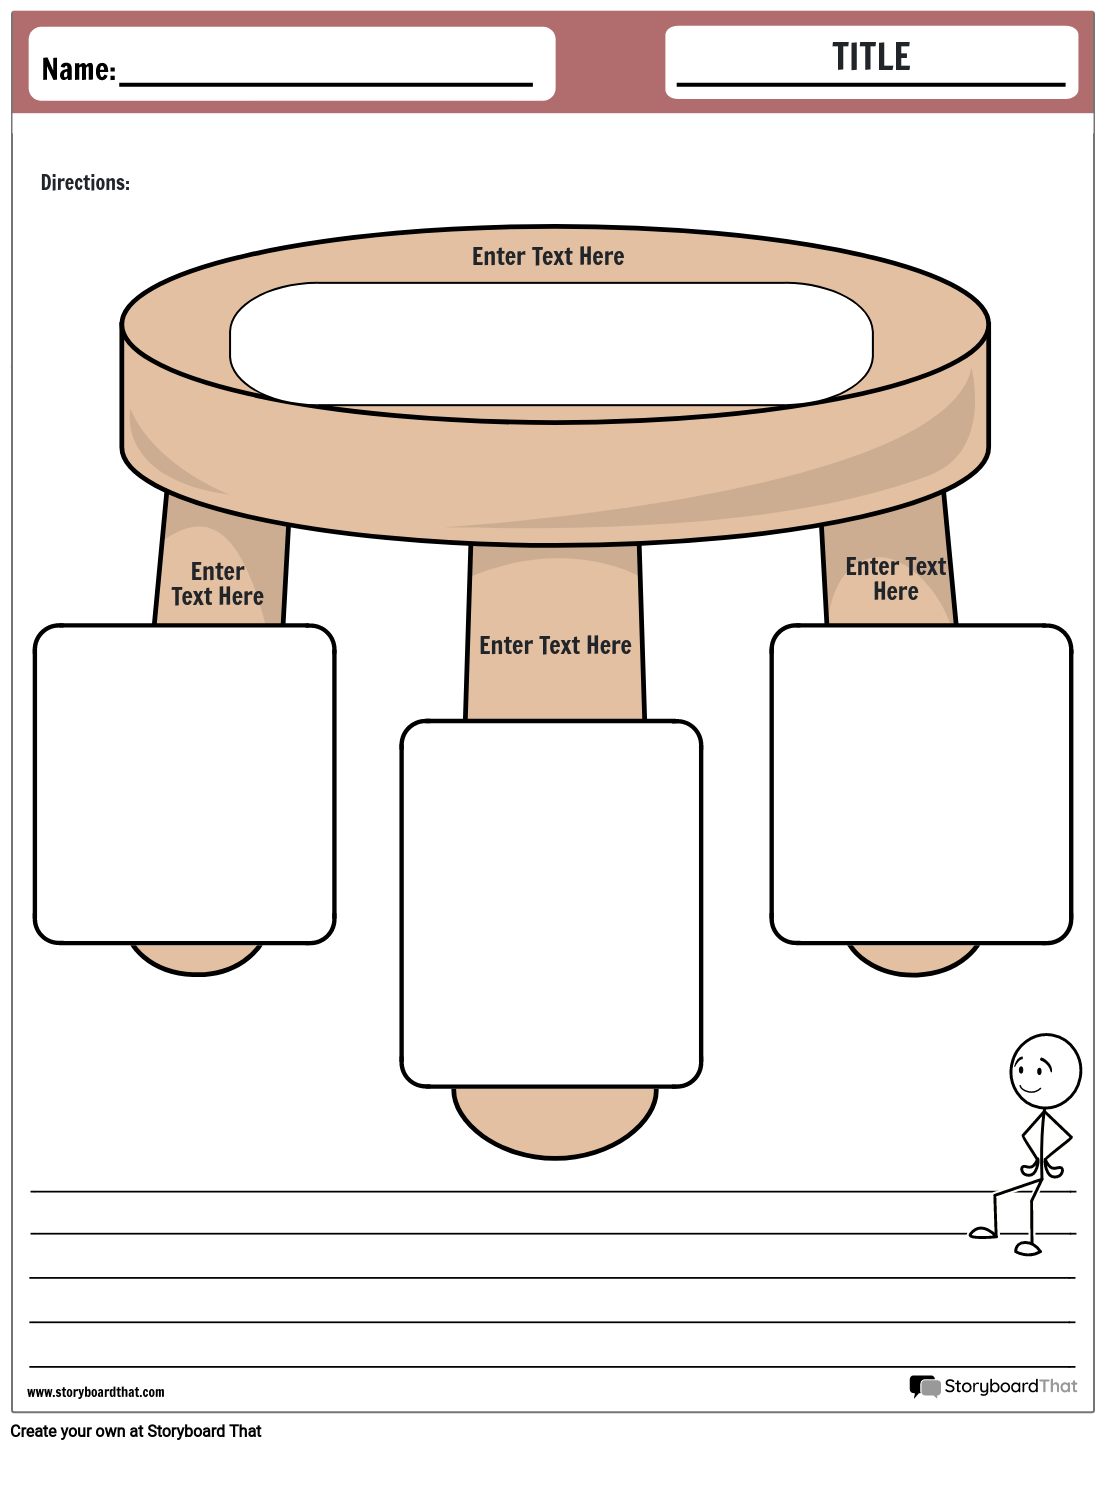
They are a highly effective and engaging tool to use in the classroom. They present information in a visually clear and concise way and, when applied, can help students learn and retain information about complex topics, terms, and ideas. Graphic organizers for are specifically tailored to this subject and can be edited to reflect the specific time period and topic you are teaching! These visual representations help students organize, illustrate, and communicate ideas presented in social studies.
Why are They Important and How are They Best Used?
They are creative forms of visual tools that assist students in comprehending and analyzing complex topics. Some types of these organizers include concept maps, timelines, Venn diagrams, and anchor charts. They serve as a framework for students to organize their knowledge, brainstorm ideas, and categorize information. When students are learning new information about a place, culture, or historical topic, it can be helpful for them to have a place to keep track of important information. It makes reviewing for quizzes and tests, research projects, and note taking easier and less stressful!
Tips on Using Social Studies Graphic Organizers for Teachers
- Utilize a Variety: Incorporate creative worksheets specifically designed for social studies. This can include concept maps, timelines, Venn diagrams, cause-and-effect charts, and KWL (Know, Want to Know, Learned) charts. Using a range of organizers helps cater to different learning styles and enhances student engagement.
- Align with Relevant Topics: Select graphic organizers that align with specific social studies topics or themes. For example, a timeline organizer can be used to map historical dates, while a Venn diagram can be used to compare and contrast different cultures or civilizations. Tailoring the organizers to the content being studied enhances comprehension and critical thinking skills.
- Promote Active Learning and Collaboration: Encourage students to actively participate in filling out the worksheet. Use collaborative strategies such as group work or think-pair-share activities to foster peer discussion and information sharing. This allows students to construct knowledge together and gain different perspectives.
- Scaffold: Provide graphic organizer social studies templates or guides that help students navigate and organize their thoughts effectively. Scaffold the process by modeling how to complete the organizer, highlighting key elements, and providing examples. Gradually release responsibility to students as they become more proficient in using the organizers independently.
- Incorporate Visuals and Color Coding: Enhance the visual appeal by incorporating relevant images, symbols, or icons. Encourage students to use color coding to represent different categories or themes within the organizer. Visual elements aid in memory retention and organization of information.
- Encourage Critical Thinking and Analysis: Prompt students to go beyond simple information recall and engage in higher-order thinking. Use the handouts to guide students in analyzing primary sources, evaluating historical perspectives, or identifying cause-and-effect relationships. This develops thinking skills and encourages students to delve deeper into specific topics.
- Use as Study Tools: Encourage students to review and study their completed graphic organizers as a study tool before assessments or exams. The visual organization of information helps students review key terms, connections, and details, reinforcing their understanding of the content.
- Provide Flexibility and Adaptability: Allow for flexibility in how students use these worksheets. Some may prefer digital versions, while others may prefer pen and paper. Offer options that suit individual preferences and learning styles, promoting ownership and personalization of the learning experience.
Benefits of Using Graphic Organizers in the Classroom
- Enhancing Comprehension and Retention: They help students visualize information, making it easier for them to grasp and remember the main idea and supporting details. By organizing ideas spatially, students can see the relationships between different pieces of information, promoting a deeper understanding of the subject matter.
- Promoting Critical Thinking Skills: They encourage this as students analyze primary sources, compare and contrast historical dates, and evaluate cause-and-effect relationships. Students categorize information, identify patterns, and make connections.
- Facilitating Collaborative Learning: They allow students to collaborate and engage in meaningful discussions. They can share ideas, compare perspectives, and work together to create comprehensive graphic organizers. This collaborative approach promotes active engagement and a deeper understanding.
- Supporting Students with Learning Disabilities: They provide a visual structure that helps students with learning disabilities better organize their thoughts and make sense of information. The visual nature of graphic organizers assists students in processing and comprehending complex topics.
- Determine the Purpose and Topic: Start by identifying the purpose and the specific cross-disciplinary topic it will address. Consider the key concepts and connections you want to emphasize.
- Choose the Appropriate Graphic Organizer Type: Select a template that best suits the purpose and topic. Options include concept maps, timelines, Venn diagrams, and cause-and-effect charts. Each type offers unique benefits for organizing information and highlighting relationships.
- Design the Structure: Create a clear and logical structure. Use headings, subheadings, and labels to guide students in understanding the different sections and categories. This ensures that information is organized and easy to follow.
- Incorporate Visual Elements: Make them visually appealing by incorporating colors, icons, or relevant images. Visual cues can help students better understand and remember information while making the graphic organizer engaging and memorable.
- Include Sections for Different Disciplines: To facilitate cross-disciplinary study, include sections within the worksheet that correspond to various disciplines related to the topic. This allows students to incorporate information from different subjects and see the interconnectedness of knowledge.
- Differentiate Sections for Highlighting Differences: Create sections specifically dedicated to highlighting how disciplines are different. This can be done through contrasting colors, labels, or specific prompts. Emphasizing this promotes encourages students to analyze varying perspectives.
- Provide Space for Communication and Collaboration: Allocate space for students to write or draw their ideas. This allows for communication and collaboration among group members or when discussing the organizer as a class. Encourage students to share their insights and interpretations.
- Utilize Primary Sources: If applicable, incorporate primary sources such as historical documents or artifacts. This helps students connect directly with the sources and analyze them within the cross-disciplinary context. Include spaces to cite or reference these sources.
- Assess Understanding: Evaluate understanding of the cross-disciplinary topic by assessing their ability to fill in the graphic organizers accurately and effectively. Consider providing feedback to help students improve their organization.
- Types of Graphic Organizers
- Brainstorming Tools
- Spider Map Graphic Organizer
- Chart Layout
- Expository Text Activities
Incorporating Graphic Organizers for Social Studies in Instruction
Pre-Lesson Activities
They can be used as pre-lesson activities to activate students' prior knowledge and stimulate brainstorming. Students can fill in blank graphic organizers for social studies, noting what they already know and what they want to learn.
Note-Taking and Summarizing
During lectures or readings, students can use graphic organizers to take organized notes and summarize the main points. They can create maps or flowcharts to capture and organize key information.
Compare and Contrast
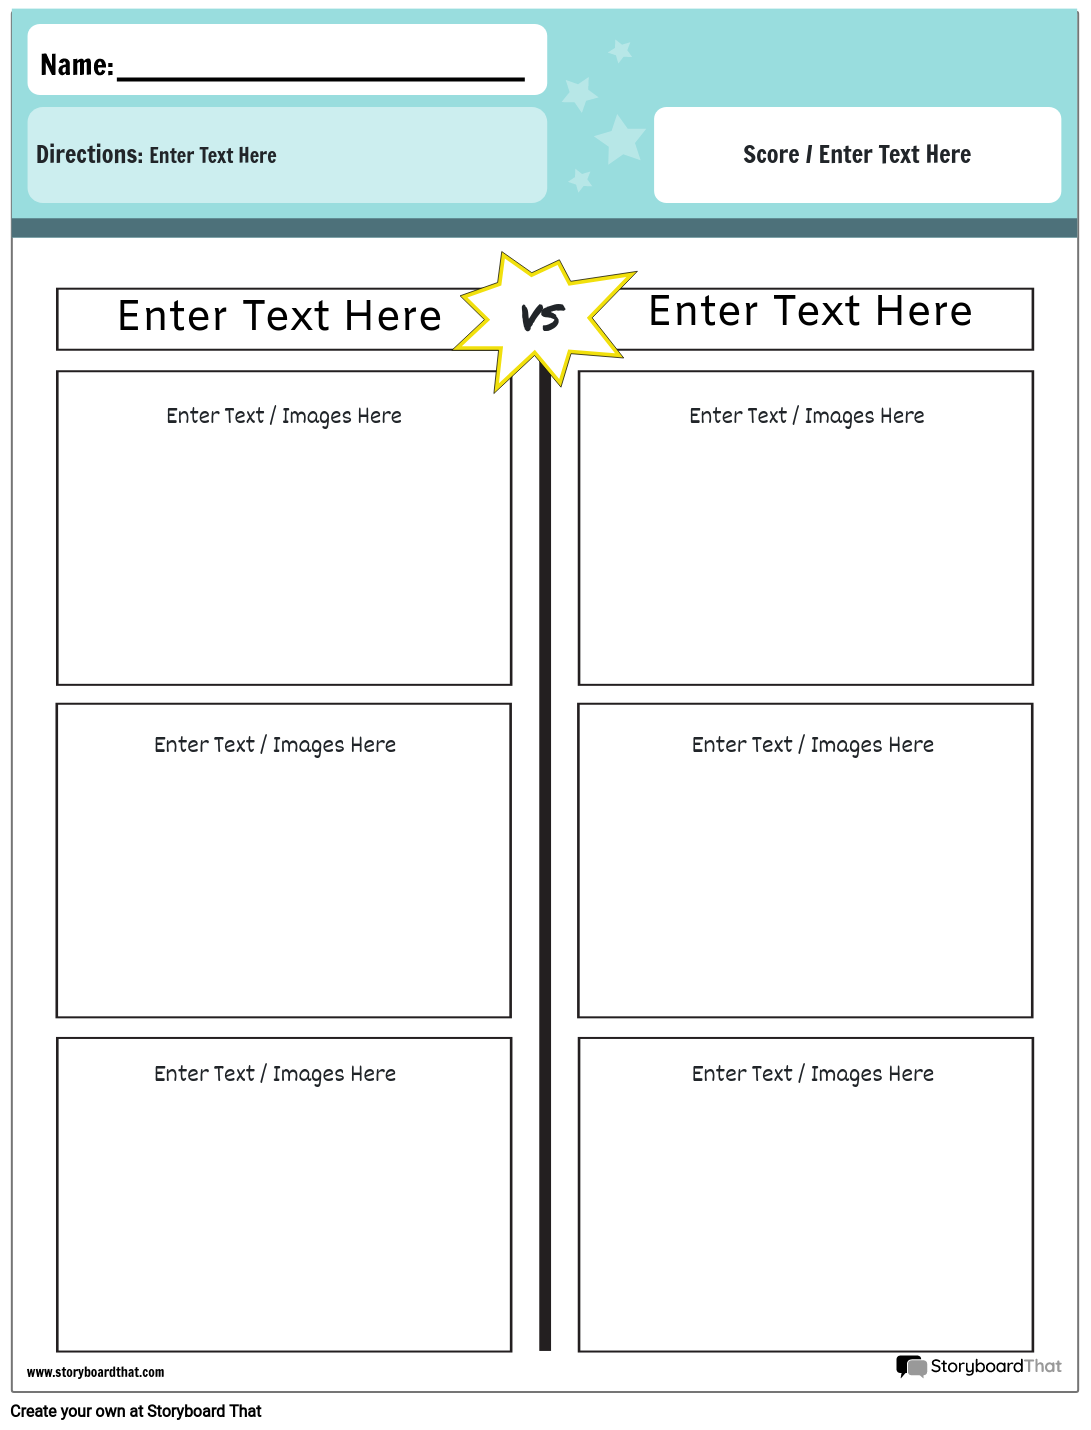
Organizers such as Venn diagrams and T-charts are useful for students to compare and contrast historical times, civilizations, or cultures. Students can identify and illustrate the similarities and differences between various topics.
Cause-and-Effect Analysis
Organizers such as flowcharts or cause-and-effect charts help students understand the relationships between factors in social studies. Students can analyze the causes and effects of times in history, enabling them to comprehend complex social phenomena.
Assessment and Reflection
Teachers can use graphic organizers as assessment tools to gauge students' understanding of relevant concepts. Students can fill in blank graphic organizers to demonstrate their knowledge, organize their thoughts, and showcase their understanding.
Tips for Making Graphic Organizers
More Storyboardthat Resources and Free Printables
How to Make Graphic Organizers for Social Studies
Choose One of the Premade Templates
We have lots of templates to choose from. Take a look at our example for inspiration!
Click on “Copy Template”
Once you do this, you will be directed to the storyboard creator.
Give Your Worksheet a Name!
Be sure to call it something related to the topic so that you can easily find it in the future.
Edit Your Worksheet
This is where you will include directions, specific images, and make any aesthetic changes that you would like. The options are endless!
Click "Save and Exit"
When you are finished, click this button in the lower right hand corner to exit your storyboard.
Next Steps
From here you can print, download as a PDF, attach it to an assignment and use it digitally, and more!
Happy Creating!
Frequently Asked Questions about Social Studies Graphic Organizers
How can graphic organizers be used to support students in making connections between primary sources and historical events?
These organizers can be powerful tools for supporting kids in making connections between primary sources and historical events in social studies. One effective approach is to utilize a timeline graphic organizer. Students can place primary sources along the timeline, using blank graphic organizers for social studies, and annotate each source with relevant details. This process allows children to visually see the relationship between the sources and the events, facilitating a deeper understanding of how primary sources inform our understanding of history. It's worth noting that there are various resources available that provide free social studies graphic organizers for teachers to use in the classroom.
Are there specific graphic organizers that work well for promoting compare and contrast activities in social studies?
Yes. One effective graphic organizer is the Venn diagram. The Venn diagram consists of two or more overlapping circles, with each circle representing a specific topic or concept. Students can list the characteristics or attributes of each topic in the corresponding circle and identify the shared characteristics in the overlapping area. This allows students to visually compare and contrast the features of different topics, helping them identify similarities and differences. Another graphic organizer that works well for compare and contrast activities is the T-chart or a double-column chart. Kids can list the characteristics or key points of each topic in separate columns and then analyze and compare the information side by side. This facilitates a clear comparison of the similarities and differences between the topics. By using these graphic organizers, students can develop critical thinking skills, analyze multiple aspects of different topics, and gain a deeper understanding of the connections and distinctions between them.
What are some examples of creative graphic organizers that can be used specifically for these topics?
There are several examples of creative graphic organizers that can be used specifically for social studies topics. One example is the concept map, where learners can visually organize and connect different concepts, events, or historical figures. They can use arrows, lines, or connectors to demonstrate relationships between the various elements. Another example is the Frayer model, which consists of a four-square chart. Students can write the main concept or term in the center square and fill in the other squares with definitions, examples, and non-examples related to the concept. This helps deepen understanding of the concept and its context within social studies. Additionally, the PMI (Plus, Minus, Interesting) chart can be used to analyze different aspects of a social studies topic. Students can identify the positive aspects or benefits, negative aspects or drawbacks, and interesting or thought-provoking elements related to the topic. This encourages critical thinking and comprehensive analysis. These creative graphic organizers provide students with alternative ways to represent and process information, fostering engagement and deeper understanding of social studies topics.
© 2026 - Clever Prototypes, LLC - All rights reserved.
StoryboardThat is a trademark of Clever Prototypes, LLC, and Registered in U.S. Patent and Trademark Office


