Customize T-Chart Templates
Exploring the Use of T-Chart Templates
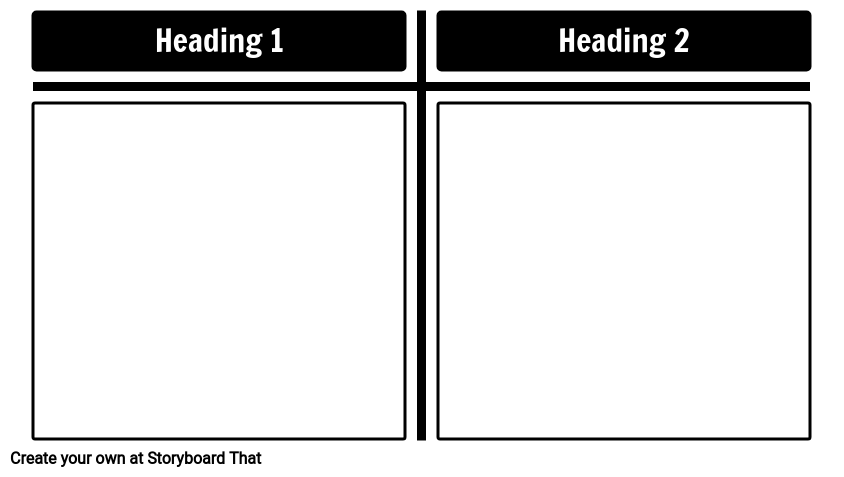
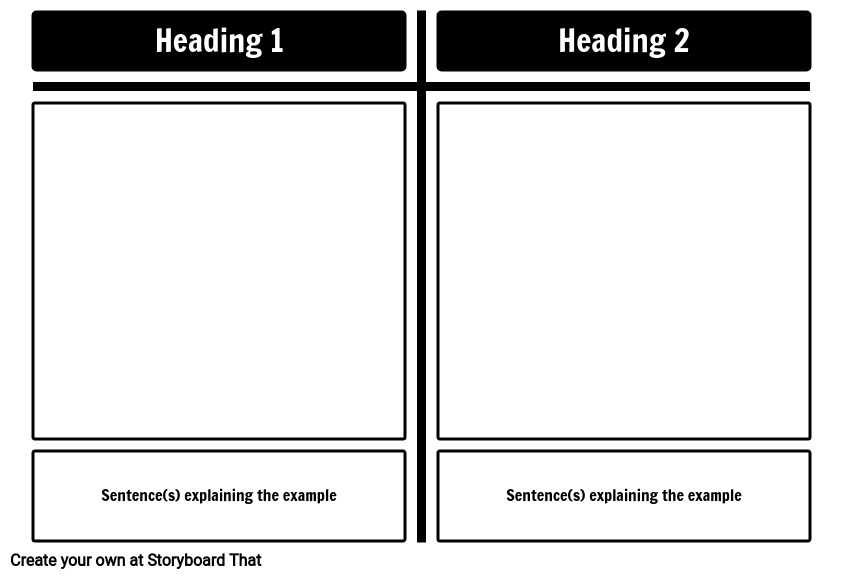
In today's classroom, educators are constantly seeking innovative tools to engage students and enhance their learning experience. One such versatile tool that has been gaining traction is the T-chart. What is a T-chart, you may wonder? T-chart templates are a simple yet powerful graphic organizer consisting of two columns, resembling the letter "T." It's designed to facilitate the comparison and contrast of information or ideas. The beauty of T diagrams lies in their adaptability, making them a valuable tool across various subjects and grade levels. Teachers often rely on these templates to facilitate structured discussions and analysis in the classroom.
Types of T-Chart Templates
- Basic Chart: The classic chart consists of two columns used to compare and contrast two sets of information, typically listed in bullet points. It is the foundation for various T-chart types.
- Pros and Cons Chart: This type of T-chart, often referred to as a pros and cons chart, helps students systematically organize information to make informed decisions. One column is dedicated to advantages (pros), while the other lists disadvantages (cons) of a given topic.
- Vocabulary Chart: A useful tool for vocabulary building, this T-chart encourages students to compare and contrast synonyms and antonyms, helping them expand their word knowledge.
- Literary Analysis Chart: Designed for literary analysis, this T-chart aids students in analyzing characters, themes, or literary elements in literature. It allows them to compare and contrast key points from a literary work.
- Math Concepts Chart: Ideal for math classes, this T-chart helps students compare and contrast mathematical concepts, equations, or geometric shapes. It can facilitate a visual understanding of mathematical differences and similarities.
- Science Experiment Chart: Essential for recording and comparing results from science experiments, this T-chart is particularly helpful for information visualization. Students can analyze differences between expected and actual outcomes.
- Historical Events Chart: History classes can benefit from using T-chart for comparing and contrasting different historical events. It aids students in understanding the causes, effects, and significance of these events.
- Language Learning Chart: Language learners can use this T-chart to contrast sentence structures or vocabulary words in different languages, helping them comprehend differences between languages.
- Social Studies Chart: This T-chart is a valuable tool for social studies classes, enabling students to compare and contrast cultural aspects, historical figures, or social issues within the subject.
- Geographic Features Chart: In geography, students can use this T-chart to analyze and compare various geographical features such as mountains, rivers, and deserts, focusing on their characteristics and significance.
- Character Development Chart: Literature and drama classes can employ this T-chart for tracking and comparing the development of characters throughout a story. It helps students understand the evolution of characters.
- Music Analysis Chart: This T-chart aids in comparing and contrasting musical compositions, genres, or musicians. Students can pinpoint the differences and similarities in musical styles.
- Art and Art History Chart: Art classes benefit from this chart for analyzing and comparing artworks, art movements, or artistic styles. It helps students appreciate the diversity of art.
- Social Issues Chart: Encouraging critical thinking, this T-chart is used to explore complex social issues. It encourages students to compare different viewpoints and potential solutions.
- Decision-Making Chart: Aids in systematic decision-making by allowing users to compare the pros and cons of various options for a given topic.
- Data Analysis Chart: Useful for comparing and contrasting data sets, trends, or statistical information, helping students understand information visualization and analytical differences.
- Graphic Organizer Chart: A versatile design with added elements like headings, labels, and arrows for more complex organization, suitable for various subjects and purposes.
- Interactive Digital Chart: Online or digital versions allow for collaboration, real-time updates, and multimedia integration, perfect for engaging students in online learning environments.
- Open-Ended Chart: Blank charts empower students to create their own categories and make comparisons based on their ideas and creativity.
- Double Chart: Two T diagrams side by side allow for more extensive comparisons or analyses involving multiple factors or sets of information.
These templates and variations cater to a wide range of educational needs, promoting critical thinking, analysis, and organization of information among students.
Tips for Creating a T-Chart Template
- Define Your Purpose: Determine the specific purpose of your T-chart. Are you creating a pros and cons chart, a T-chart graphic organizer, or a basic T-chart? Clarifying your objective is the first step in creating an effective chart.
- Choose Your Format: Decide whether you want to create a T-chart online or on paper. If you prefer an online approach, look for a reliable online T-chart maker or software.
- Select a T-Chart Type: Identify the type of T-chart that best suits your purpose, whether it's a graphic organizer chart, a template for a pros and cons chart, or a more general T-chart.
- Gather Your Data: Determine the two columns or categories you want to compare or contrast in your chart. Clearly label these columns, defining the specific information you'll be organizing.
- Create the Template: If you're creating a paper-based chart, draw a large "T" on a sheet of paper, with one column on the left and another on the right. Label each column appropriately. For digital templates, utilize your chosen T-chart maker or software to establish a well-structured layout.
- Design and Customize: If using digital tools, take advantage of formatting options to customize your T-chart. Adjust fonts, colors, and add graphics as needed to create an engaging and visually appealing chart.
- Label and Add Instructions: Place clear labels at the top of each column, indicating what type of information should be entered into each section. If necessary, provide concise instructions to guide users.
- Test and Review: Before finalizing your T-chart, input some sample information to ensure it effectively serves its purpose. Review it for clarity, organization, and overall appearance.
- Save or Share: If you're using digital tools, save your T-chart in a format suitable for sharing, such as PDF or image files. For paper templates, make copies as needed.
- Share and Distribute: Share your T-chart with your intended audience, whether it's your students or colleagues. Ensure they understand how to use it effectively, whether it's for creating a T-chart online or on paper.
By following these steps, you can create a well-structured and purposeful T-chart template that aligns with your educational goals and serves as a valuable tool for organizing, comparing, and contrasting information. Whether you're a teacher looking for educational resources or a student in need of a handy tool, the internet offers an array of accessible free T-chart templates that cater to various subjects and topics. If you want to save time and create a T-chart efficiently, you can make a T-chart online using various user-friendly tools and software available on the internet. For instance, accessing a T-diagram is easy with Storyboard That! Storyboard That allows you to make a T-chart online using specialized tools, allowing you to input and analyze your data with ease.
More Storyboard That Resources and Free Printables
- T-Chart Worksheet Templates
- Behavior Chart Poster Templates
- Comparison Chart Templates
- Circle Chart Templates
- Anchors Chart Poster Templates
How to Make a T-Chart Template
Choose One of the Premade Templates
We have lots of templates to choose from. Take a look at our example for inspiration!
Click on "Copy Template"
Once you do this, you will be directed to the storyboard creator.
Give Your Worksheet a Name!
Be sure to call it something related to the topic so that you can easily find it in the future.
Edit Your Worksheet
This is where you will include directions, specific images, and make any aesthetic changes that you would like. The options are endless!
Click "Save and Exit"
When you are finished, click this button in the lower right hand corner to exit your storyboard.
Next Steps
From here you can print, download as a PDF, attach it to an assignment and use it digitally, and more!
Frequently Asked Questions about T-Chart Templates
Are T-chart templates suitable for all grade levels and subjects?
T-chart templates are adaptable and suitable for all grade levels but vary in complexity. They work well for teaching basic concepts in elementary school, become versatile tools for critical analysis in middle school, and continue to be valuable for advanced subjects in high school and beyond. Their application should align with specific grade-level objectives and complexity levels.
What are the common applications of T-chart templates in education?
T-chart templates are commonly used in education for comparing and contrasting, vocabulary building, math concepts, science experiments, literary analysis, historical events, language learning, social studies, data analysis, and decision-making. They promote critical thinking and organization across subjects.
What's the difference between a T-chart and a Venn diagram?
A T-chart is a basic tool with two columns used for direct comparisons between two categories or sets of information. It's clear and straightforward, emphasizing differences and similarities. On the other hand, a Venn diagram employs overlapping circles to represent relationships between multiple categories or sets of data. It not only highlights commonalities but also shows how elements are unique to each category. Venn diagrams are often used for more complex comparisons involving three or more items or concepts.
© 2026 - Clever Prototypes, LLC - All rights reserved.
StoryboardThat is a trademark of Clever Prototypes, LLC, and Registered in U.S. Patent and Trademark Office


